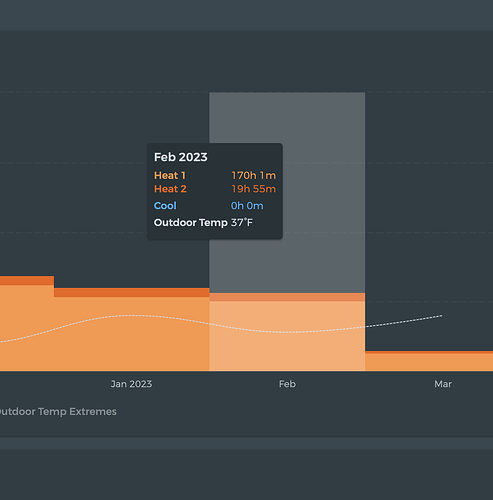
I’ve been experimenting with having the fan run alone without heating or cooling. It would be nice to see the runtime as an option on the thermostat summary
Yes!  I do plan to add this.
Here’s the list of things that this chart theoretically supports:
✓ avg_outdoor_temperature
✓ max_outdoor_temperature
✓ min_outdoor_temperature
✓ sum_auxiliary_heat_1
✓ sum_auxiliary_heat_2
✓ sum_compressor_cool_1
✓ sum_compressor_cool_2
✓ sum_compressor_heat_1
✓ sum_compressor_heat_2
avg_indoor_humidity
avg_indoor_temperature
avg_outdoor_humidity
sum_dehumidifier
sum_economizer
sum_fan
sum_humidifier
sum_ventilator
It’s not that hard to add other things, but it becomes weird conceptually when you start stacking things like humidifier runtime on top of heat runtime because it’s honestly just a different thing. The chart would require a z-axis which is a bit much.
I think the best option would be another chart entirely. But instead of copy/pasting I have some plans for making these charts more extendable. For example, you could customize your dashboard to include two “Thermostat Summary” charts and decide what each one shows. With that framework in place it would be trivial to add these fields to a second chart without having to duplicate a bunch of work.
@ziebelje I’m definitely interested in this feature still. Any turn around time for it being built? I would be glad to provide some patreon support for this particular feature. Dehumidifer summary that is.
I’ll poke at this again and see. I know I started this and think I may even be storing the data but need to revisit.
I think this’ll be a really neat feature. Is there any way to add the ‘average_setpoint’? In the data series I noticed set point was broken out by heat and cool, but it would be nice to have that data shown visually also so that 2 days with the same average temperature could be differentiated if you were away all day vs. home all day.
It’s a great idea. For me, I’m trying to figure out when to change my furnace filter. Using Beestat, I can see the runtime since last change, where I found out that in the 6 months of winter I used the fan 1500 hours. In teh summer months it was 500 hundred. Obviously, if I could find a chart/graph/data and find out where 1000 hours is, it would be pretty great. I know it doesn’t fit your model perfectly, but finding time between two points would be useful, I think. Thank you for listening. --Pete
I noticed a number of requests for Humidifier runtime. I’d like to add to that request, with a slight twist. Would be very helpful, especially if you have a steam humidifier, to track humidifier runtime with electrical consumption based on kw per hour. I do that manually now by using the Ecobee app export feature, but would really cool if it was part of beestat.
Food for fodder.
Thank you
Hi John - moving this into the existing thread since it’s similar enough.
Could you elaborate a bit more what you’re wanting to see? Do you mean the ability to enter your humidifier power consumption (ex: 50w), then see on the summary chart the total usage (ex: 1kwh)?
Hi…. I think you’ve got it. Maybe a user story on how I do it manually today.
- I pull the total number of seconds that my steam humidifier runs for the month.
- I convert the number of seconds to hours.
- I know my humidifier using 3.84kw/per hour. Basically 3840watts
- I know my electricity is .15c per kwh
$$$=(total number of seconds/3600)3.84.15
You know how you show on the analysis tab the runtime for heat and cooling stages, an extra line that shows humidifier runtime in hours would probably suffice (pic below) if you don’t want to add in all the additional calculations.
This is probably more relevant for anyone that has a steam humidifier. I use the information to judge the cost of humidification.
Thank you for reach out. Ago
