I use a very simple threshold to open the windows and turn off the A/C. If the dew point is below 58F, then the mold risk is minimized. It would be great to see that in beestat rather than have to pull up another app and it was color coded based on that threshold.
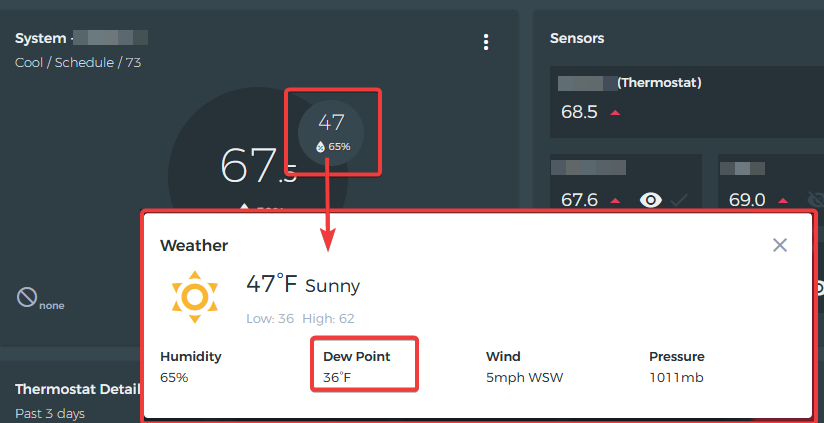
You can get to the current value by clicking on the weather circle to view additional details. This is not something that ecobee stores historically, so it’s not feasible to add a graph for it unfortunately. Short of the color coding, is this what you’re looking for?
That’s good to know! You can calculate the dew point from the relative humidity and temperature actually