Display formula for line of best fit for Temperature Profiles

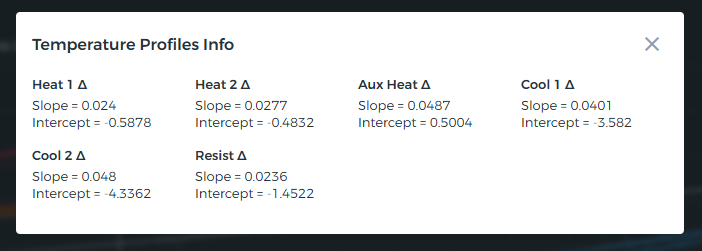
It would be great to be able to optionally see the y=mx+b form of each temperature profile’s line of best fit.

This would be convenient for users to be able to make calculations for themselves based on the data displayed rather than having to grab individual points and calculating them themselves.

Sure, this is a great idea. I’ll add to my list!

1 Like

Added! Open the menu on this card and go to “More Info”

You may also be interested in this update:

Awesome work, Jon! Much appreciated!

1 Like

This topic was automatically closed 7 days after the last reply. New replies are no longer allowed.