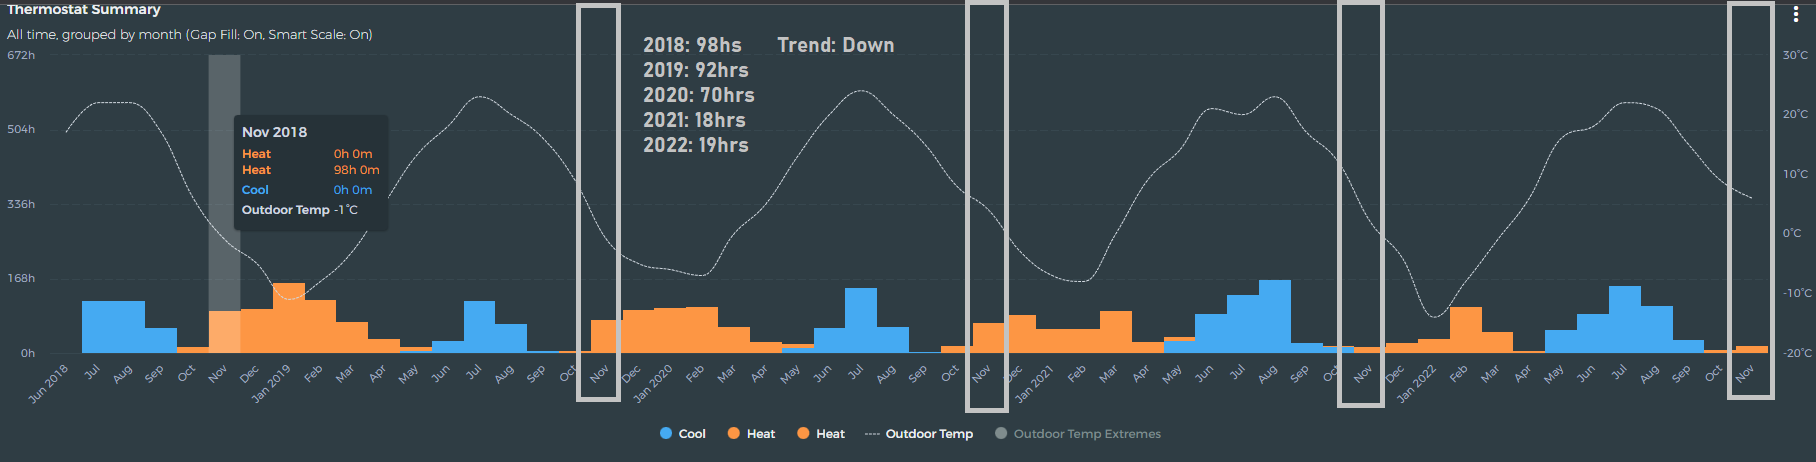
I would like to see a year over year list of months so I dont have to scroll over them to get the figures.
Issue/Request: View runtime hours for month XYZ each year to determine is runtime is trending upward or down. Similarly for household humidity would be a benefit. Calculating these types of metrics on mobile is a challenge due to how small the bars are on year view.
In the Runtime Summary, I’d like to see an entry in the mouse-over data (Heat/Cool/Outdoor Temp) that indicates +/- percentage of year-over year runtime. (Compared to exactly 1 yr ago today, you are running 11% more…_)