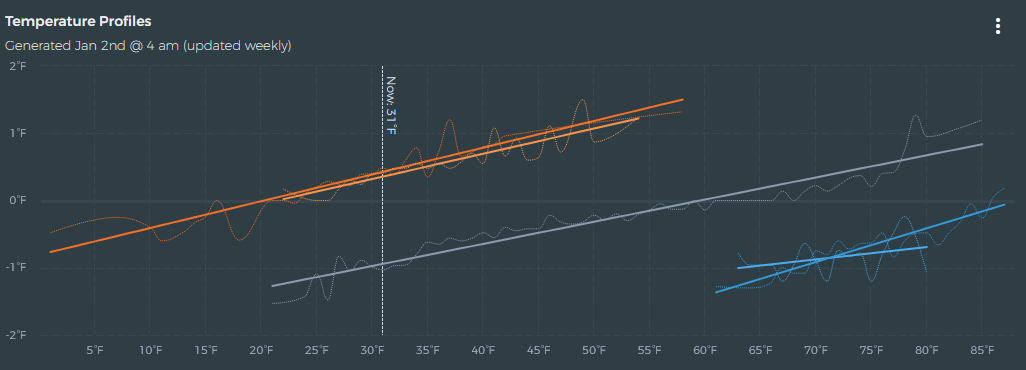
Would it be possible to graph first and second stage heat/cool separately from each other? Right now the curve for my heating score makes no sense because when it’s cold outside my first stage runs continuously followed by the second stage kicking occasionally or during the morning during smart recovery. This makes it look like my house heats faster as it gets colder outside and my heat has random peaks in it with higher rate of change as it gets colder outside. I would like to get an idea how much more the second stage kicks out for heat but graphing both stages on a single line doesn’t allow that. Thanks
It’s coming…eventually! Patrons should have access to this experimental feature right now. If you just want to check it out for a bit just pledge and then cancel before February and you won’t be charged.
Thanks this is really going to help me size my next furnace and AC unit. Seeing where stage two heat is going to cross the x axis is a huge help as the current furnace is oversized and doesn’t run continuously on stage 1 unless it’s -20 outside.
1 Like
This is set to go live this Friday.
1 Like
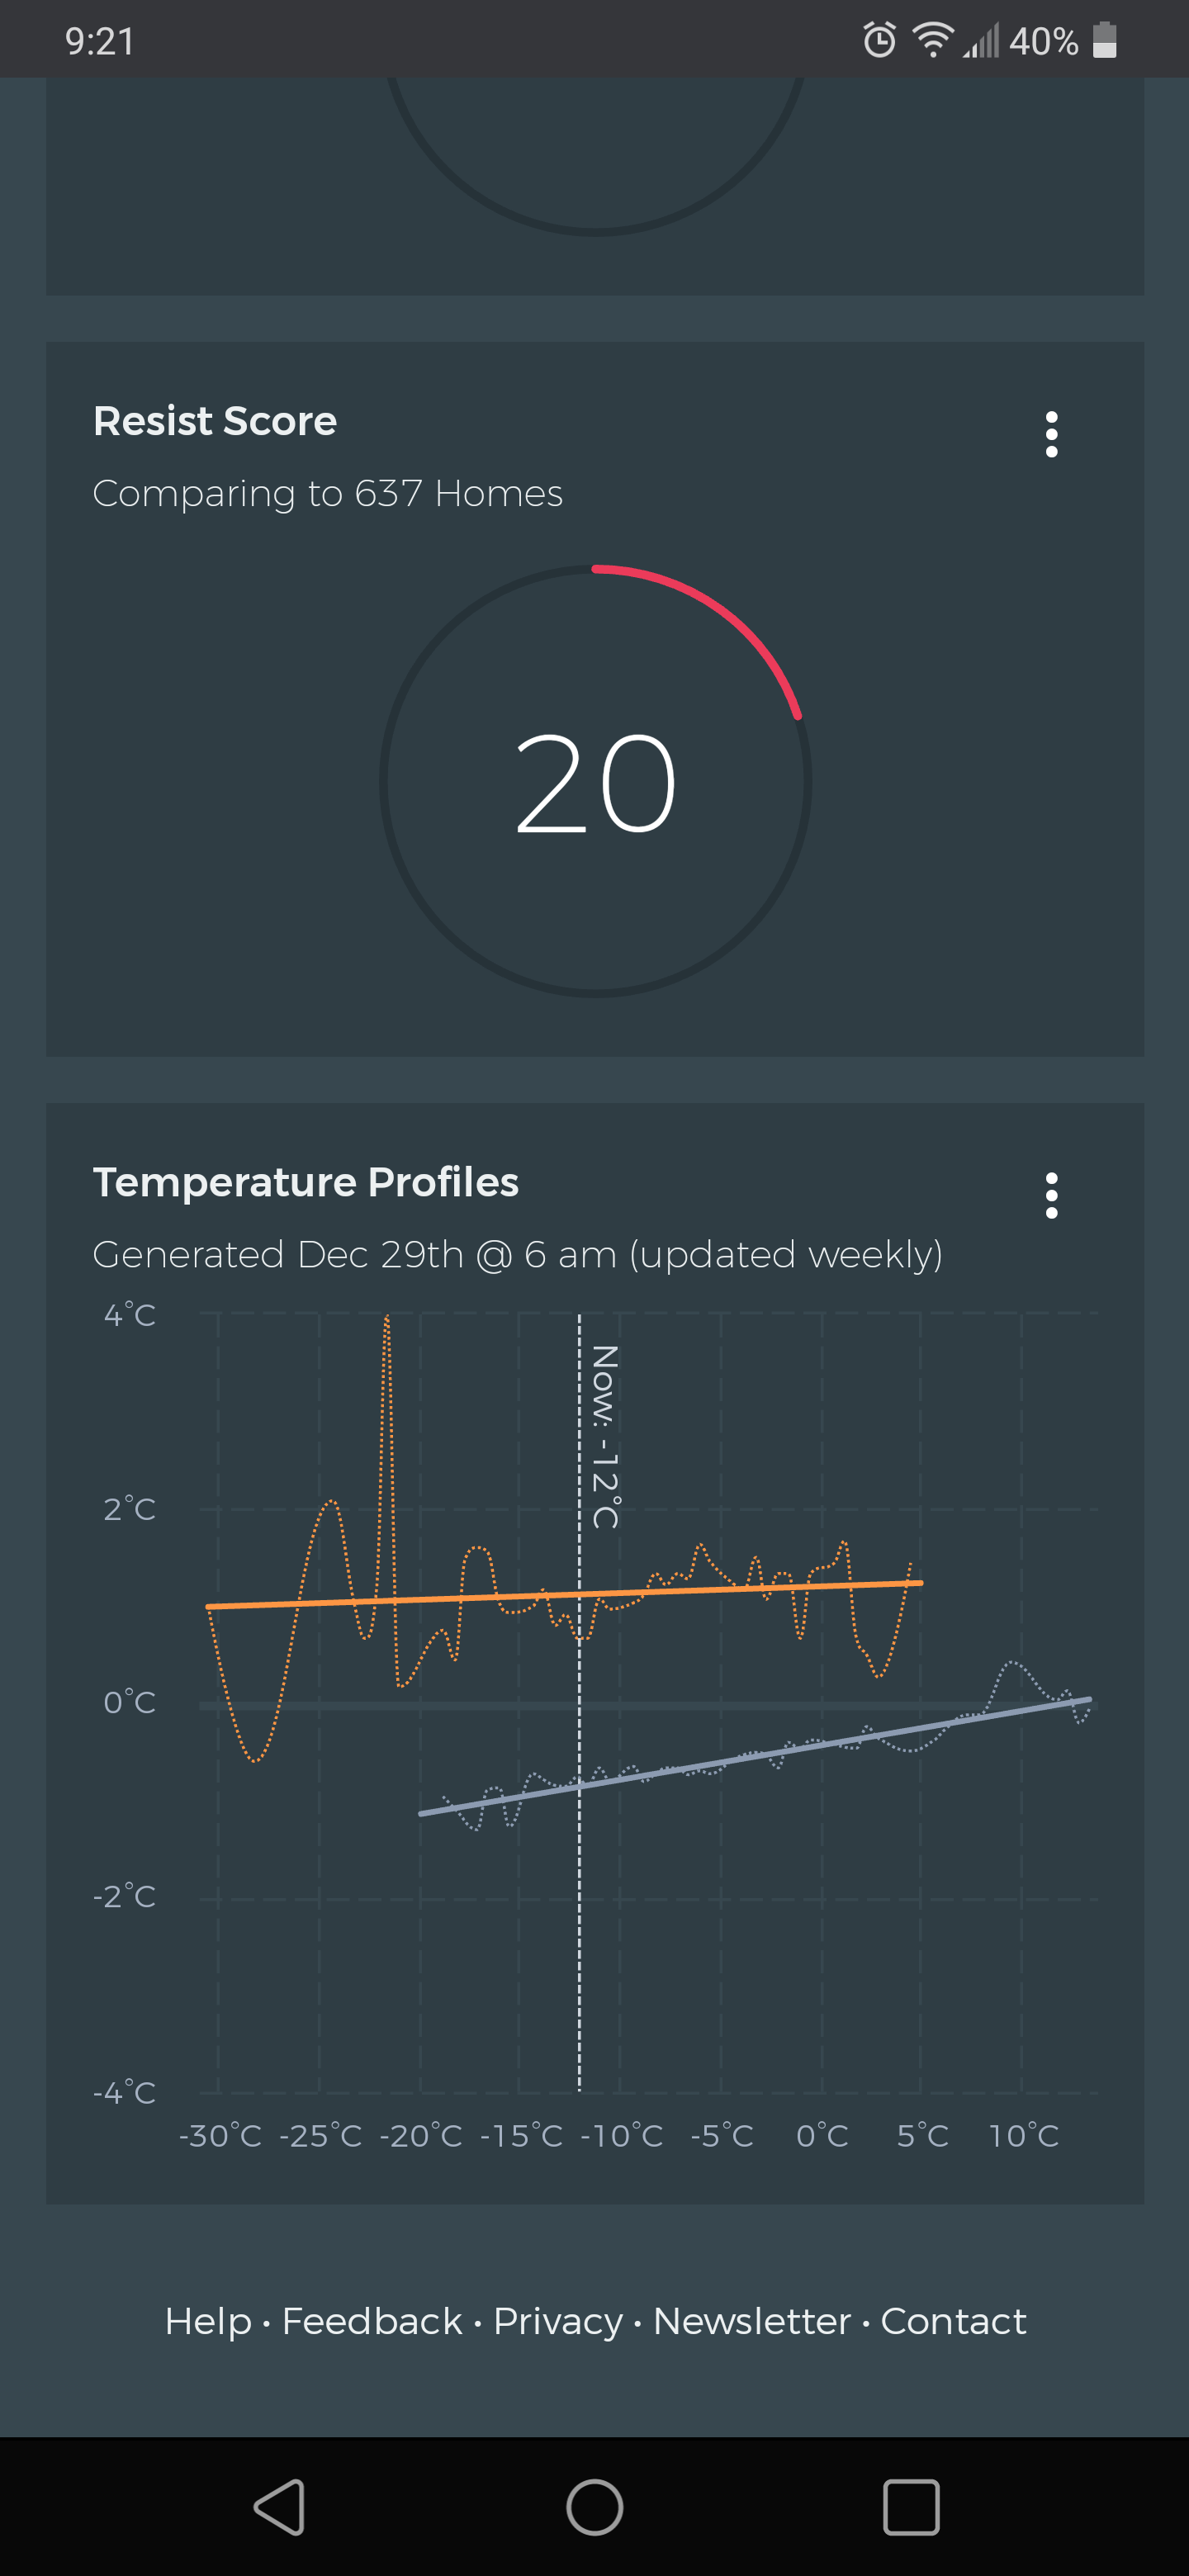
I do like the new temperature profiles; they seem to be more accurate than the old ones (based on the balance point that each of them calculate - the new one is more accurate). The concept is fantastic, and the analysis you do makes the Ecobee so much better.
I think I read that aux heat is ignored (not sure if that’s the case, because I haven’t run much aux since setting up beestat). I’m definitely interested in seeing profiles for aux, to try to judge if there’s a point where the compressor drops below 100% efficiency. I think I also read that you’re going to be reporting on deltas between the current heat profiles and historical performance - I think that is a great idea and look forward to it.
Did this go live? My chart still looks like a single stage of heating.
Yep. PM me your serial number and I can take a look and see what’s up.
Just to make sure I read the docs right, and the right docs, multiple stages of heat are reported separately, but aux heat is ignored, right?
Just making sure I know what to look for. I think I have a total of 1 hour of aux heat this month, so there isn’t much data to work with.
Also, I saw an interesting pattern a few days ago. It was right at 32F outside, and we had a light rain. I could actually pick out defrost cycles every 90 minutes in the thermostat detail graph. For a while, the house was actually cooling some - even though I was above my ~27-29F balance point. I think that’s a corner case and probably not worth trying to pull from the data, but just something I found unusual.
Rick
Correct. For now aux heat is ignored for temperature profiles and metrics. First and second stage heat/cool are reported separately.
That’s actually neat. It might be possible to extract the defrost cycle time from the data.
I’m still not seeing a trend line for my heating stages all I have is a resist trend line on my graph. Is there a minimum number if weeks before there’s enough data to plot it?
This topic was automatically closed 8 days after the last reply. New replies are no longer allowed.