Not sure if this is a bug or if I’m not interpreting the data correctly.
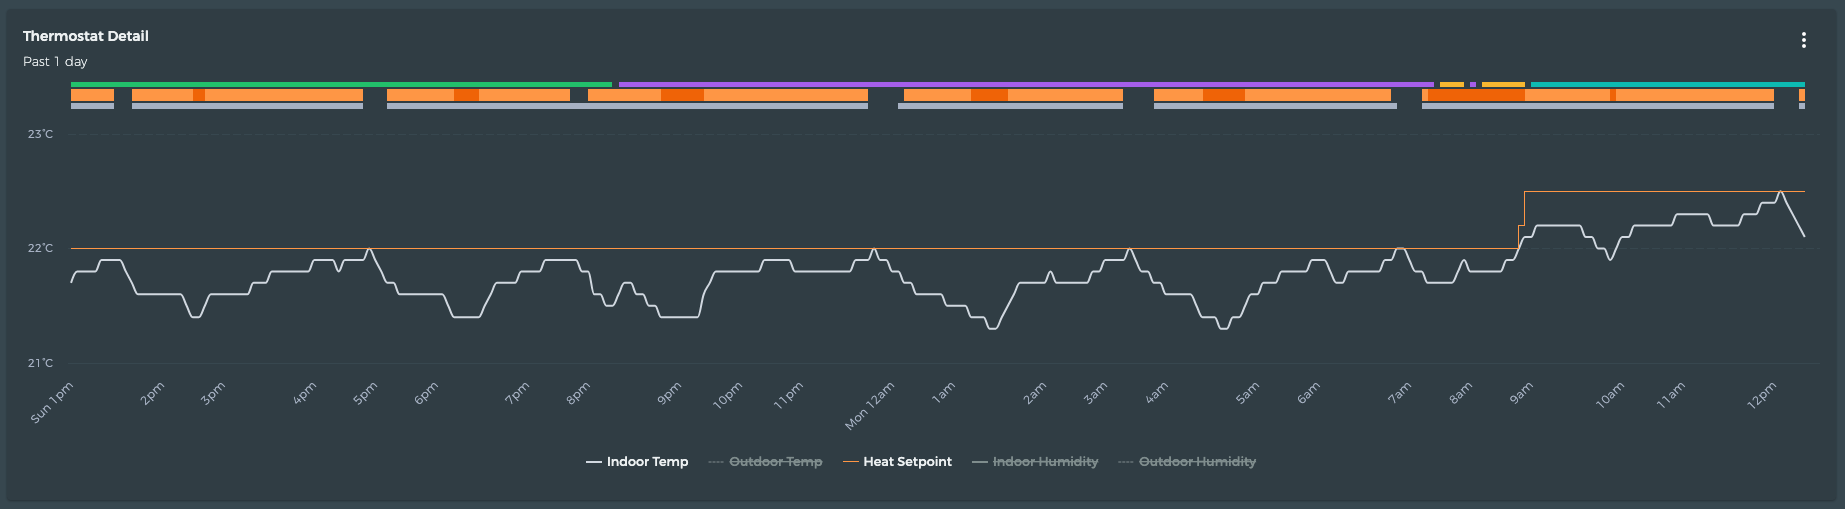
My Heat1 says 0.0C/hr and Heat2 says +0.1C/hr while Resist says -0.6C/hr. Based on this my house is losing heat faster than the hvac system can heat it up, but that’s not actually true. The house is maintaining the set point and I can see the temp increasing in the charts. I have a heat pump system. Beestat screenshots below:
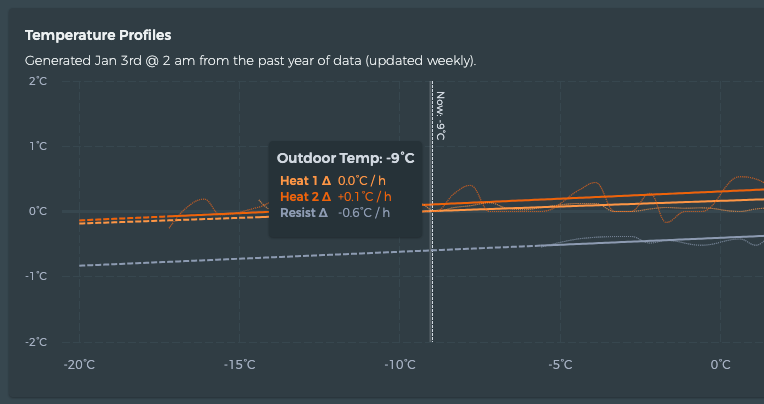
Your heat1 & heat2 temperature slopes are a net heat after the application of the rest gain or loss to the value is applied. The temperature slopes are not gross, but net.
1 Like
Got it, that makes sense now. Thanks!
I think the confusion is from the labels which make me think of heat output of the hvac system as opposed to the resultant indoor temperature change.
Perhaps a mini table like this in the tooltip would help:
| Heat 1 | Heat 2 | Aux | |
|---|---|---|---|
| Heat Gain | 0.6°C / h | 0.7°C / h | - |
| Heat Loss | -0.6°C / h | -0.6°C / h | -0.6°C / h |
| Net Change | 0.0°C / h | 0.1°C / h | - |
(Aux values aren’t showing in the app yet for me, I guess due to very limited aux runtime.)
1 Like
This topic was automatically closed 7 days after the last reply. New replies are no longer allowed.