I posted this to github before but am recreating it here for possible discussion.
In the Thermostat Summary chart I would like to see weekend dates highlighted similar to how they are in the Ecobee Weather Impact graph.
I also thought beestat could go one step further, since not everyone’s schedules are the same and they may not be home on the weekends and at work during weekdays. I propose highlighting days where the Away profile was on more than the other days. This could either be figured out automatically, or be a setting such as > X hours away per day = a non-highlighted ‘work’ day. Any day with the Away profile active for less than that setting out be highlighted as a day your usage would be higher than normal due to being home more.
I like it - this idea could be part of a new metric
I also created a github issue to see if Ecobee/Beestat is able to determine Away vs Home via the Comfort Profile. It might not be possible when an automation (Homekit or HomeAssistant) sets the Ecobee away: https://github.com/beestat/app/issues/258
I can highlight weekends, but I always pause because one person may want weekends, another person may want Wednesdays, and another person may want November-March for some winter home.
Instead of picking some arbitrary thing to highlight, I look for the desired analysis. In this case it’s analyzing runtime vs comfort profile.
Knowing that, it’s the challenge of coming up with something that can accurately represent that. And how do you handle situations where the “home” comfort profile is usually at night, and the “away” comfort profile is usually during the day. Runtime during “away” will typically increase simply due to the average increased outdoor temperature.
It’s tricky to pull out only the one thing we care about, especially with runtime, because there are many other factors that need to be accounted for.
I want to be cautious with metrics…they can be a really great tool but metrics at this point are designed with home comparisons in mind. This specific situation doesn’t really fit into that box. Might be something similar, though. There are lots of little things like this that don’t really need their own huge chart, but would be interesting to see and possibly compare to yourself month over month.
I think the quickest, easiest, helpful for most people option would just be to implement something similar to the ecobee date highlight for weekends. I would love to figure out something better and more accurate, but this would likely help the majority of people with the least effort
It’s an interesting idea, but also totally irrelevant to someone who like me who does non-static shift work and weekends are sort of a meaningless construct.
I agree with @ziebelje that if it’s done, it’s probably best to figure out the flexible answer that allows for highlighting based on a variety of user needs. As he mentioned, though, that’s a tricky design problem.
I’m not against highlighting weekends, just that it would be lower down on my personal wish list than some of the other things being worked on.
Even better, would be to make the dark gray background of the graphs, shaded slightly brighter during daylight hours (assuming you presumably can get the location from API???).
You might have to get me a visual on that one. That wouldn’t be applicable on the Runtime Summary chart as that’s limited to one column per day. The Sensor & Thermostat Detail charts would support something like this.
I always like coming up with intuitive visual ways to help people visualize data. Just looking at a bunch of numbers along the bottom of a chart isn’t always easy.
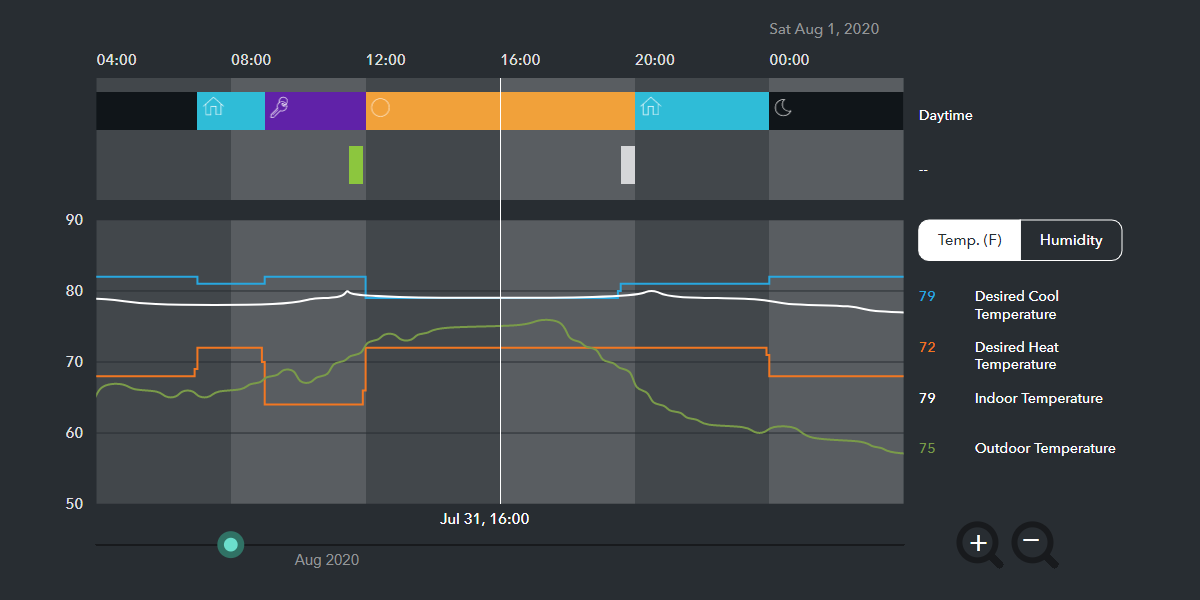
Here’s a visual, from the way Ecobee does it (four hours at a time, unless you zoom in). You could do it either alternating by day, or by sunrise/sunset.