I noticed the new Degree Days line in the Thermostat summary graph, but I don’t understand what it’s telling me.
Thanks in advance.
I noticed the new Degree Days line in the Thermostat summary graph, but I don’t understand what it’s telling me.
Thanks in advance.
Here’s an article I put together to help answer that. Let me know if you have any other questions!
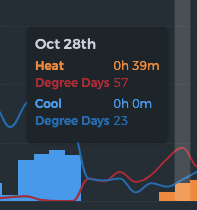
Oh, looks like you have since fixed the graph. As you can see in the screenshot, I was getting 57 and 23 degree days for heating and cooling, which did not seem right and made me wonder if I was misinterpreting the data. The same day now shows as 5.7 and 2.3, so I guess it had been erroneously multiplied by 10.
As I was writing the article I noticed the error. ![]()
I’m not seeing degree days on my charts. I can get it if I download my profile but I’m not sure what time period that’s for.
Would it be possible to do degree days based on wind chill instead? Just thinking something that accounts for wind and humidity would be a better comparison across different days.
Paul Williams, are you saying that your house is drafty and the interior temperature on heating and cooling days is affected by the wind? I would think that most people keep doors and windows closed when the heat or AC is on.
My understanding is that wind chill is normally a parameter that is only relevant to how humans perceive temperature when the wind hits our skin. And it would not “to first order” change the rate of heat gain or loss between the outside and inside of a house.
Yes, older homes especially, or any that aren’t air sealed very well, wind will play a huge factor. I know wind chill is more of a human thing, but it at least takes wind and humidity into account and if used for comparing runtimes across two days or periods would be fine. I figured it would be easier to get historical data on rather than trying to calculate Johnson degree days.