Sizing Replacement HVAC Equipment Using Runtime Data
I’d like to offer a couple of methods for those who are interested in sizing a replacement furnace / heat pump using beestat / ecobee data. See the GBA article by Dana Dorsett “Replacing a Furnace or Boiler” for the technical background on these methods. I’ve used some example data from my ecobee for the illustrations.
Ecobee runtime data is equivalent to the fuel usage used in the article, assuming you know the Btu/hr rating of your equipment. Beestat already tracks the necessary HDD / CDD data. If you’re already using the NEEP Cold Climate Air Source Heat Pump List to select equipment, the 99% design temperature can be found through the “Advanced Search - Sizing for Heating and Cooling” tool.
Key Parameters
- Furnace Input Rating [75,000 Btu/hr] + AFUE [80% Efficiency]
OR Furnace Output Rating [60,000 Btu/hr]- Furnace Runtime [179h in Nov.] + Heating Degree Days [992.1 in Nov.]
OR Runtime Per Degree Day Metric [11m]- Design Temperature dT [68°F Indoor - 5°F 99% Temp = 63°F dT]
The Quick Method
The Runtime Per Degree Day metric on the beestat Compare tab and the design temperature give us an estimate of how often the equipment needs to run on the coldest days of the year.
First convert the runtime in minutes to a runtime in % per degree temperature difference:
11m/°F-day * 1d/24h * 1h/60m = 11m/1440m-°F = 0.7639% / °F
Multiplying by the design temperature dT gives us a % runtime at 5°F outside, 68°F inside:
0.7639% / °F * 63°F dT = 48.125%
The current equipment needs to run 50% of the time on the coldest days of the year, suggesting it may be twice as big as needed.
Using the Btu/hr input of the current equipment gives us an approximate heat load:
48.125% * 60,000 Btu/hr = 28,875 Btu/hr
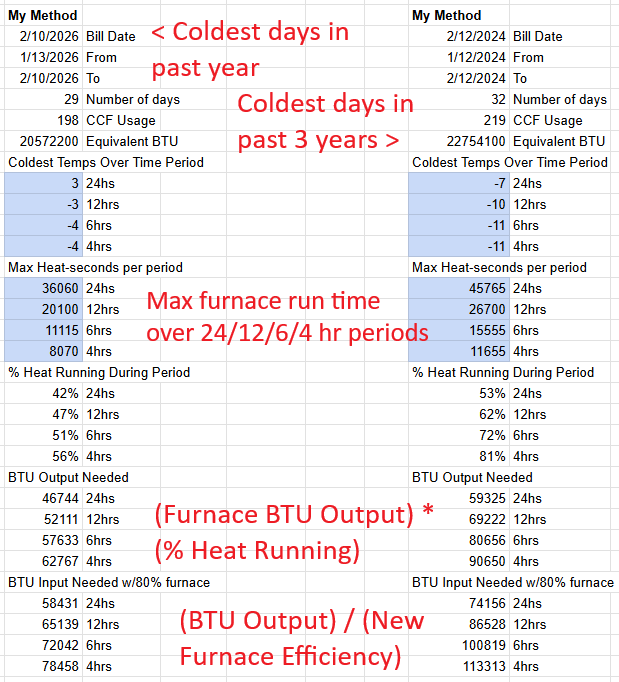
The Custom Period Method
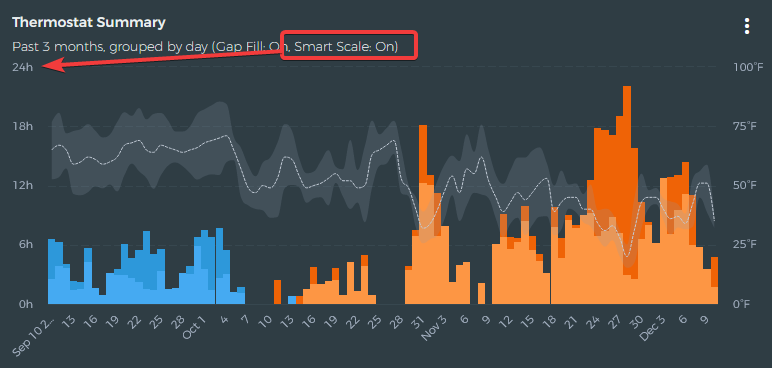
Selecting a bin from the Thermostat Summary table can provide the above runtime and degree day parameters, and you can find your runtime per degree day metric manually. You can use the Custom time period to select a specific date range if desired.
For November on my thermostat:
179h/992.1°F-day * 60m/h = 10.8m/°F-day
Using the math from the quick method section:
10.8m/°F-day = 47.362% = 28,417 Btu/hr
Sizing the Replacement
ASHRAE recommends a 1.4x sizing factor:
28,417 Btu/hr * 1.4 = 39,783 Btu/hr
The heat load above is the heat output needed from the furnace to keep the home warm. To find the input needed, we need to account for the efficiency of the furnace. Divide the heat load by the efficiency to get a Btu/hr rating you can shop with:
39,783 Btu/hr / 80% = 49,730 Btu/hr at 80% AFUE
39,783 Btu/hr / 95% = 41,878 Btu/hr at 95% AFUE
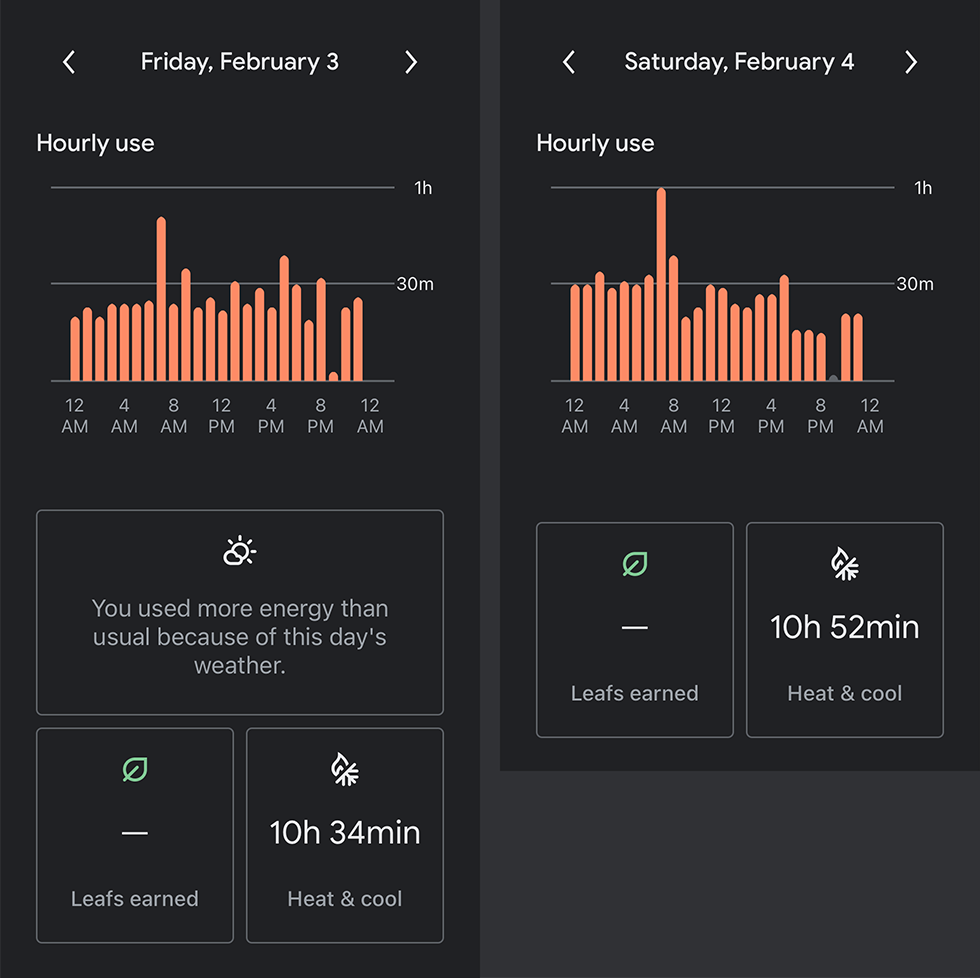
The Sniff Test
On a really cold day, listen for when your furnace cycles on and off. How long does it run? 50% of the time? 75% of the time? Equipment is usually most efficient and most comfortable when the runtime can be maximized, and short cycles are indicative of oversizing. When sizing for a modulating heat pump, it may be best to target 100% runtime at the 99% design temperature and rely on backup heat to cover the remaining 1% of the year to minimize low-load cycling at warmer temperatures.
Notes on Accuracy
Using the fuel-bill method in the GBA article, I get a heat load of 29,406 Btu/hr, within 5% of the ecobee data. The Manual J from a computer model was 47,100 Btu/hr, about 66% higher than the direct measurements. Variables like duct loss, home air leakage, and internal loads are directly accounted for in the runtime measurements.
Two stage equipment can still be processed using the above equations. I multiply the Stage 2 runtime by the turn-down ratio and add it to the Stage 1 runtime.
13.95h Stage 2 * (100kBtu/hr / 75kBtu/hr) = 18.6h Stage 1 Equivalent
Summary Equation
Btu/hr Input of Replacement = 1.4 * Runtime per Degree Day/1440 * (68°F - Design Temp) * Current Furnace Btu/hr Output / AFUE of Replacement