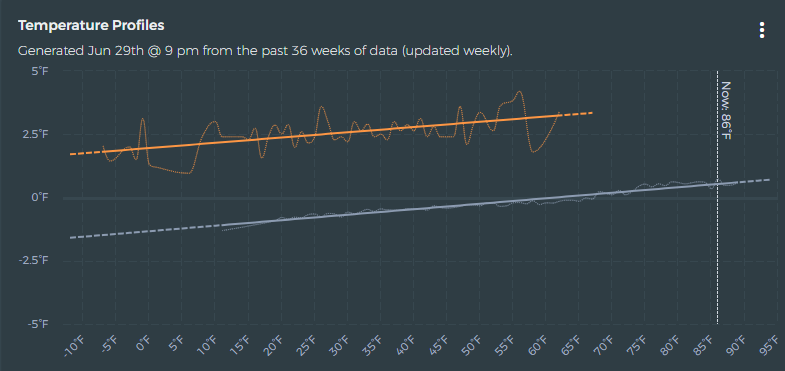
Using this graph, and the knowledge that my current furnace is outputting 49,000 BTU, is there a way to say what the correct size furnace should be? My cold weather low should be 5 degrees, so in my mind, it looks way too high at that point, is it safe to say a 24,000 BTU Furnace would cover my heating needs?
Ultimately most places are going to size a system based on your home’s size, age, and their experience in the past. Ideally they should be looking at your entire home and doing proper load calcs based on your windows, insulation, etc (it’s called a Manual J) but realistically unless you pay them they aren’t going to bother.
I would use a chart like this (and maybe even some other beestat charts) to give them more data so they can make the right decision when sizing the system. You can’t only use this chart, because you don’t know how far cutting the BTU in half moves that orange line down.