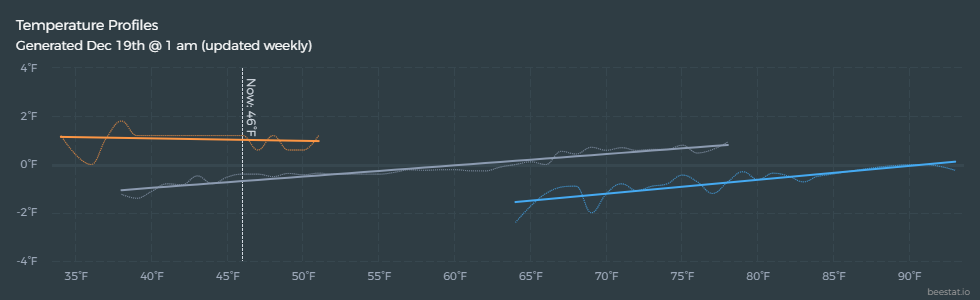
Sometimes the slope is positive, & sometimes it’s negative:
Yeah, sometimes it’s wrong. A number of things can cause that, many of which I have tried to address or at least improve on in the newer version of that chart. I’m hoping to get around to getting some of the new things pushed out soon so I can start making more improvements to address it.
The majority of the time it’s correct and accurate, but things like solar heating, external heat sources, and more powerful second stages can all improperly factor in here.
“… solar heating, external heat sources, and more powerful second stages …”
I have none of those.
I do have a south-facing large bedroom window & a southwest-facing bathroom window. Those rooms (each with a sensor), depending on whether the sun is shining, are either the coldest or warmest rooms in the house. In the winter, I can see 10 degree temperature swings in those rooms during the day, as the sun pops in and out of the clouds. In the summer, when the other rooms are warmer as well, the A/C tends to moderate the swings in those two rooms.
I’ve got the same question. My 2nd stage curve is opposite what I would expect. Is it possibly related to 2nd stage run time treated as additional to 1stage run time, when ecobee treats 2nd stage run time as concurrent with 1st stage?
If anyone is experiencing this please feel free to reach out with a serial number to contact@beestat.io. Sometimes there are things outside of my control that cause this, but I can often help pinpoint a reason after looking closer at the data.