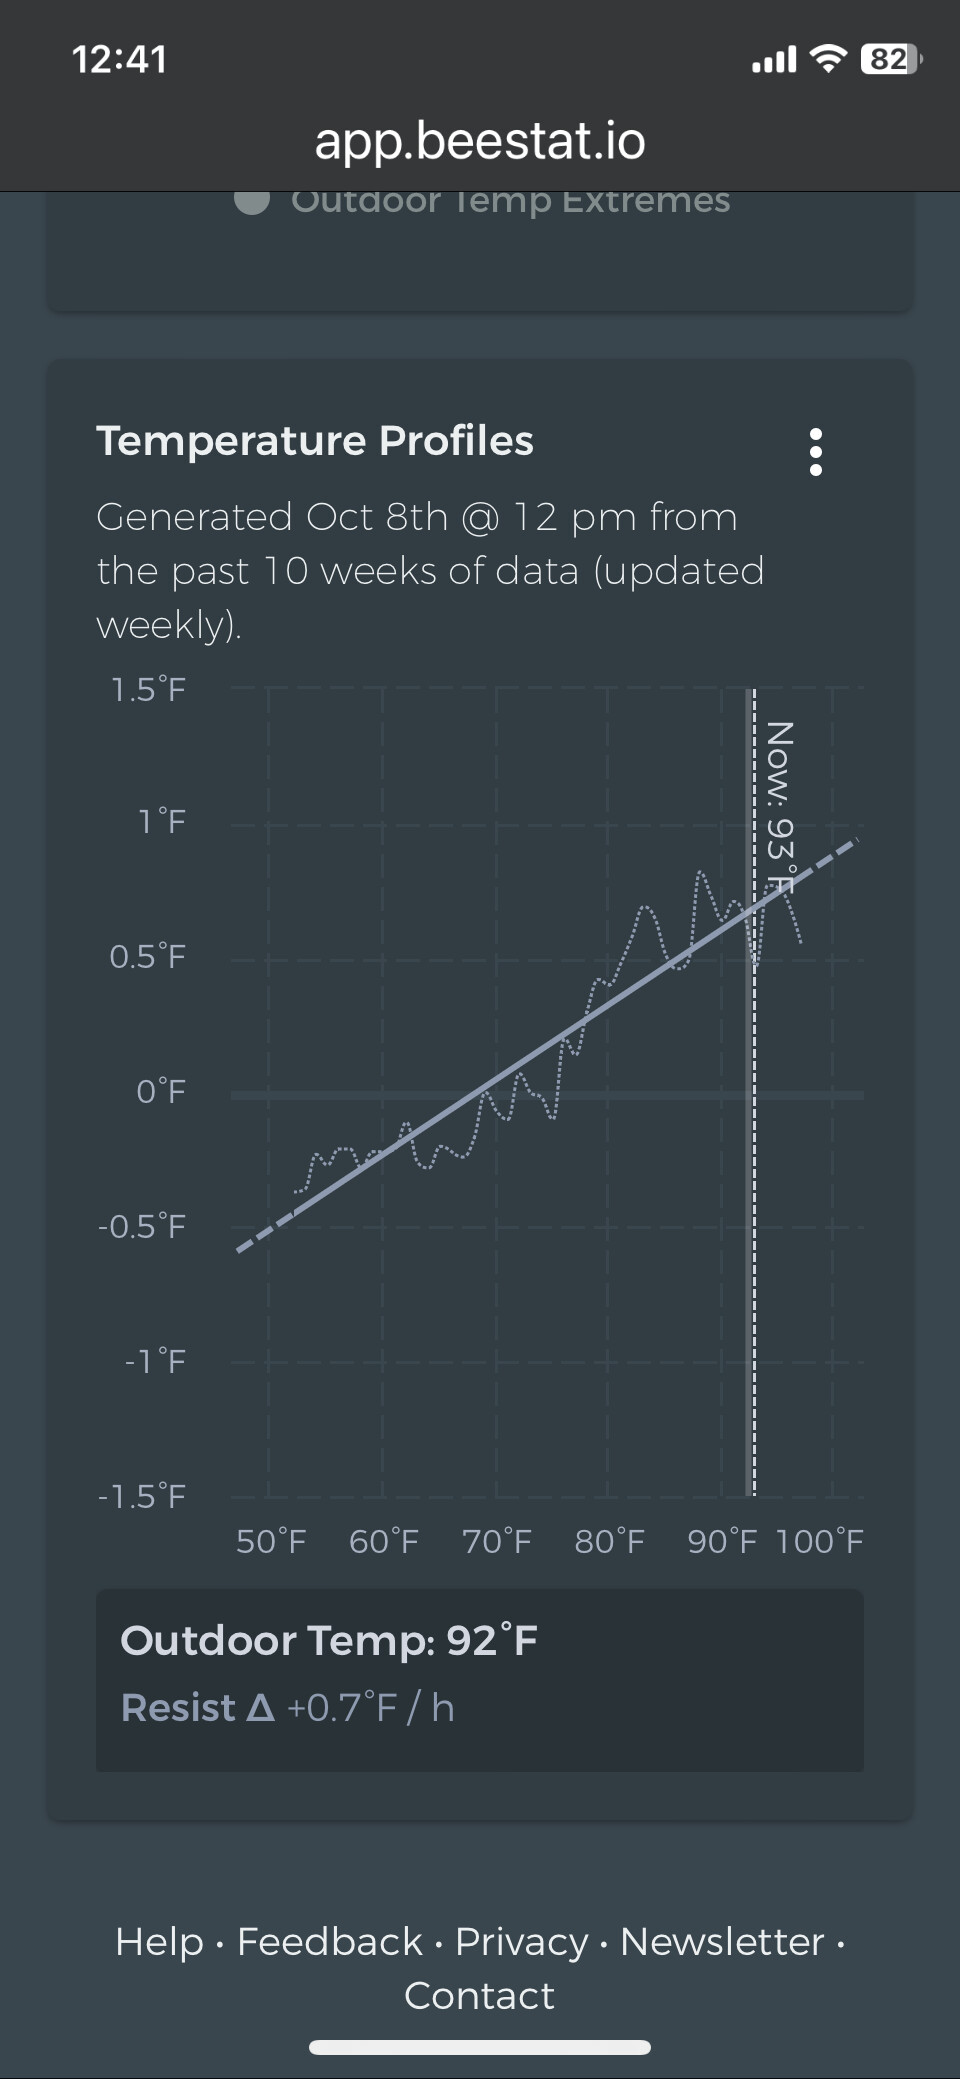
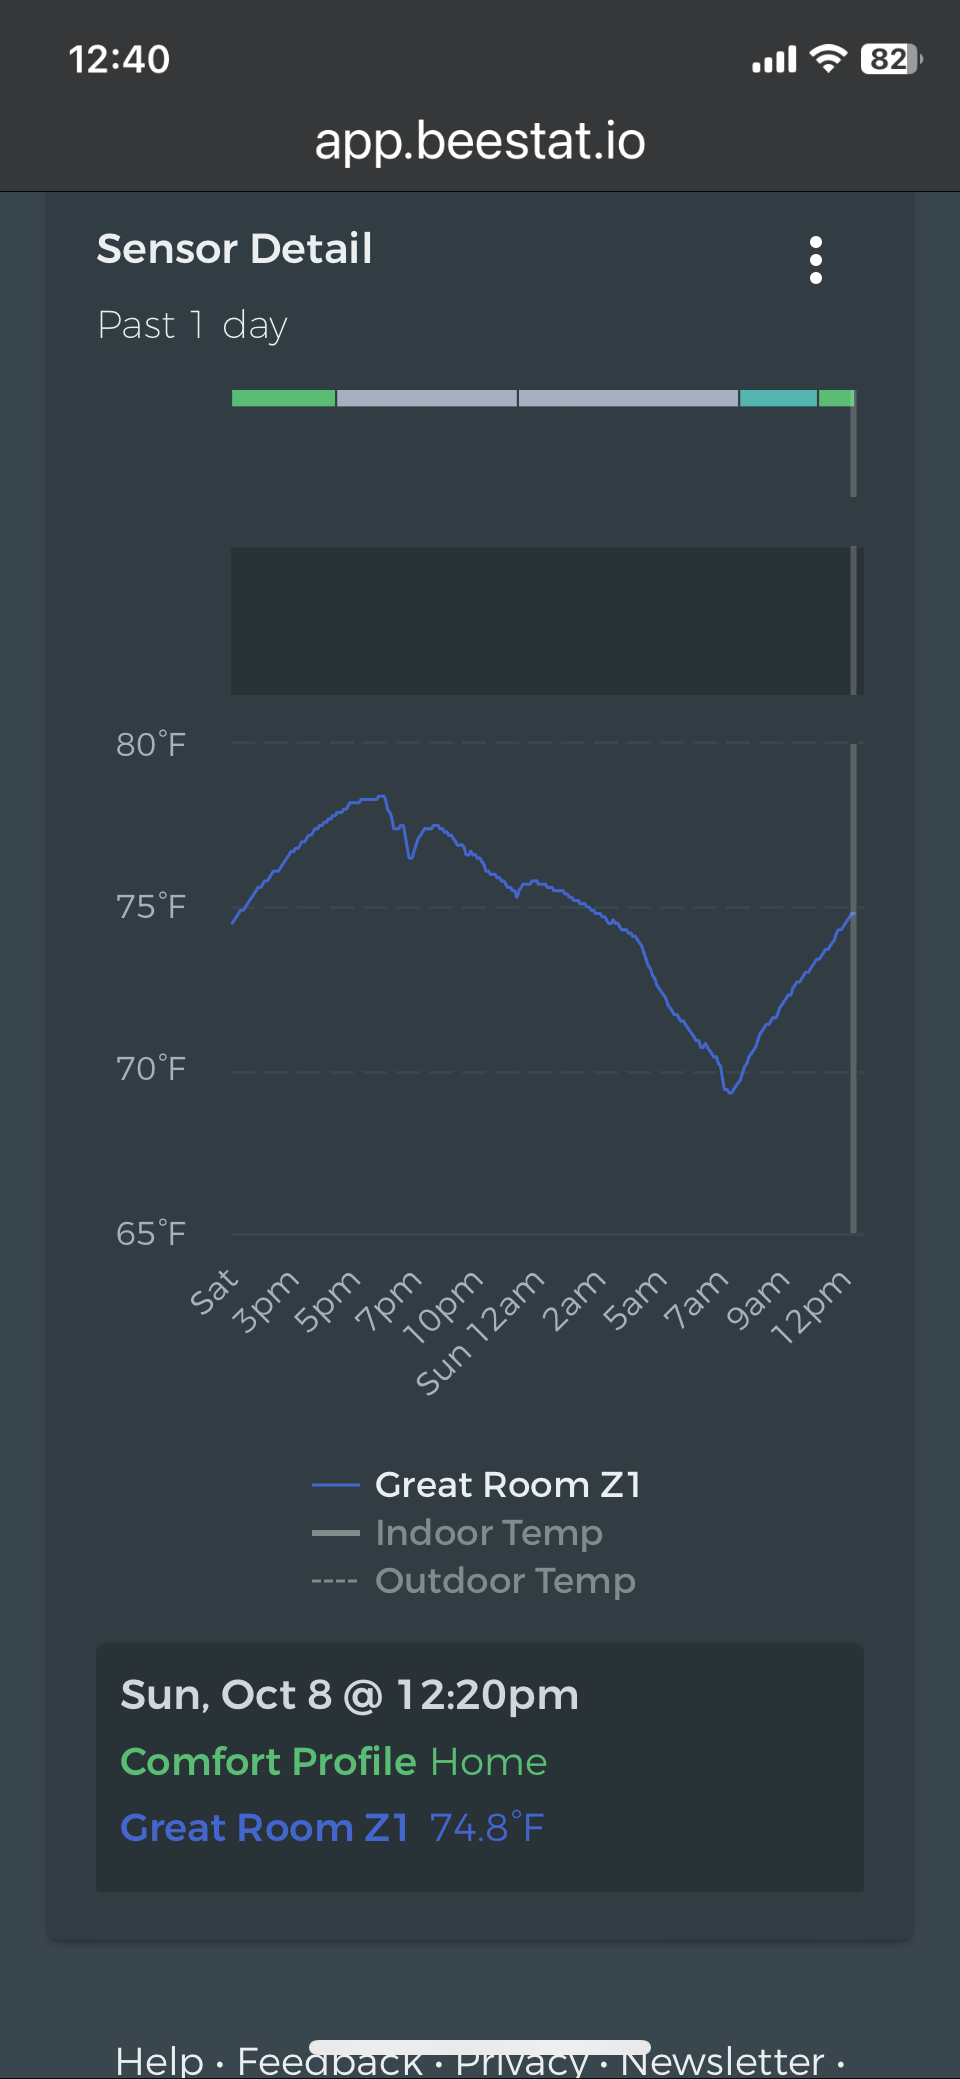
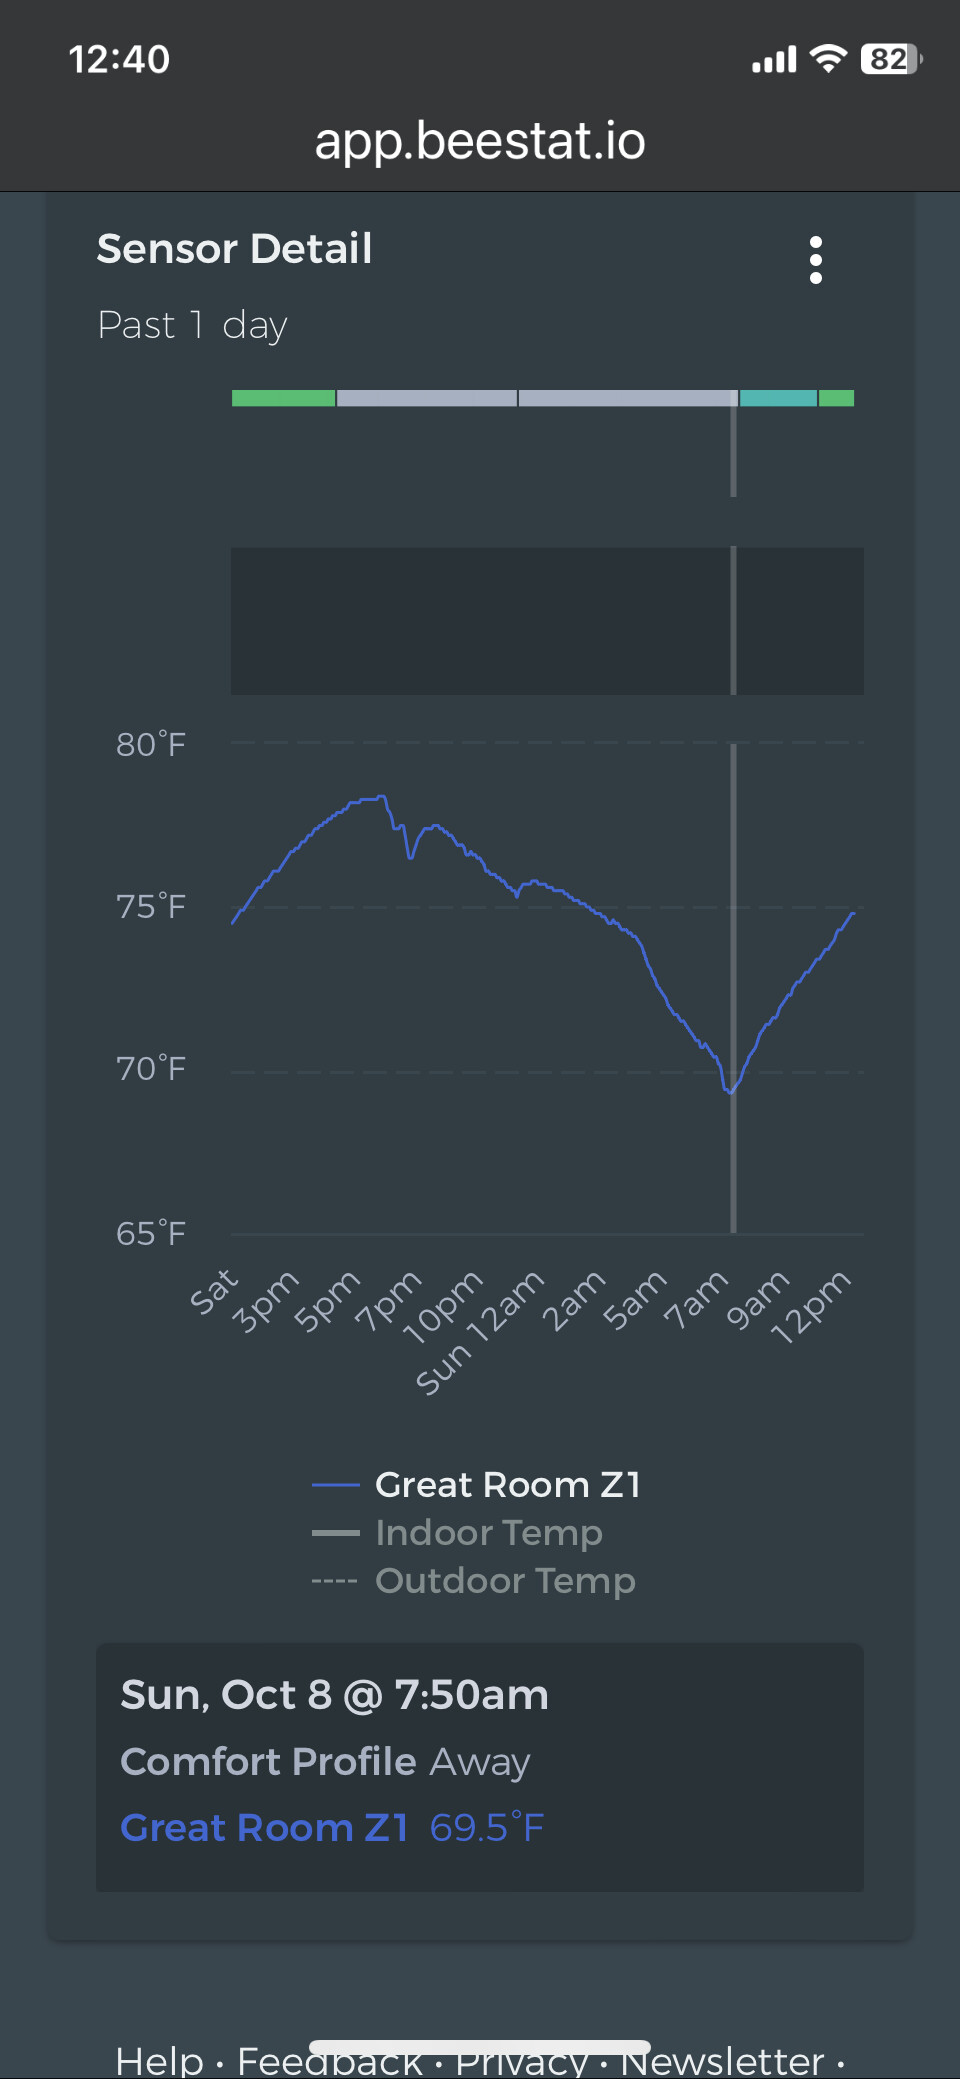
This is for my education purpose…I was reviewing the Resist Delta chart on one of my thermostats. Maybe my interpretations of the data is wrong, the suggested trend line resist delta value seems off. For example, my sensor at 7:40am was at 69.5F, and at 12:20pm, it
was 75F, and the outside temperature is at 93F per app (my weather app says 90F). The chart’s trend line gives a Resist Delta value of +0.7F/h @ 93F outside temp. If I used this number and applied it for the rough 5h interval between the sensor readings, the temp should have been 73F instead of the 75F which the sensor actually shows (i.e., 69.5+ 0.7x5)? A 2F degree at the +0.7/h Resist delta value would translate into ~3 more hours. That’s significantly off. How should I interpret the trend line reading?
Could you let me know your thermostat serial number (you can PM it), or at minimum a screenshot of your Temperature Profile chart? It would help to see that before making any guesses about what might be happening. Thanks!
It’s actually even worse than what you described, because you didn’t account for the outdoor temperature changing. I did some quick calculations for that 8 hour period where the indoor temperature increases and found the change to be about +1.0°F/h. During that time period, the average outdoor temperature was 88°F which is only +0.6°F/h on the profile.
I can take a closer look later tonight to see what data the profile is using. It could just be that it needs more data, or maybe your zones are interfering a lot, or the recent weather conditions heavily differing from the average, or a recent change to your home. Let me know if you can think of anything relevant here and I’ll see what I can come up with.
Yes, I have simplified my rough calculations by ignoring the changes in the outdoor temperature during that 5-hour period.
I have 2 zones in my house controlled by 2 separate EcoBee Lite thermostats. They were installed back in July, 2023 when installer swapped out my Nest with the EcoBee due to some compatibility issues that they ran into when they installed the furnace. One of the zones are mostly off based on the heat/cool set-points that I set. For this thermostat sensor that I had questions with. It controls the HVAC heat-pump and the dual-fuel furnace. The thermostat is mounted on a wall which is in the hallway shielded from direct sunlight and window/patio door openings, so its reading tends to be more stable than my actual living room temperatures where there is plenty of glazing. I am not sure if this would make a difference, I make it as a habit to reduce the amount of electricity usage by opening all my windows and patio doors early in the morning. It helps drop the room temperature by up to 4-5F.
This gives the EcoBee more margin to work with before it needs to kick on the AC. Other than that, I am using the thermostat normally. I do notice that the Resist Delta has always been lower than my expectation.
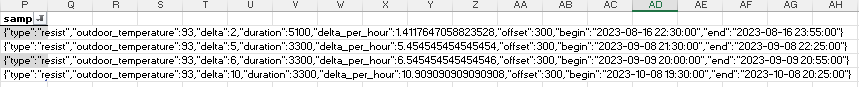
Here’s a bit of data that should help explain where beestat’s coming from. Those are the four samples beestat is currently using to calculate your profile at an outdoor temperature of 93°F.
Notice the delta_per_hour values (note: divide by 10 for the correct values). You’ve got 0.14°/h, 0.55°/h, 0.65°/h, and 1.09°/h. The most recent value matches what we currently expect, but those historical values from the past couple months are part of the average.
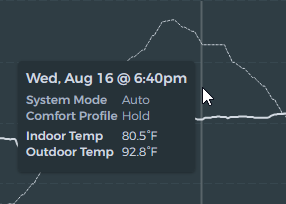
Here’s one of them. The bold indoor temperature line is barely increasing despite it being 93°F outside.
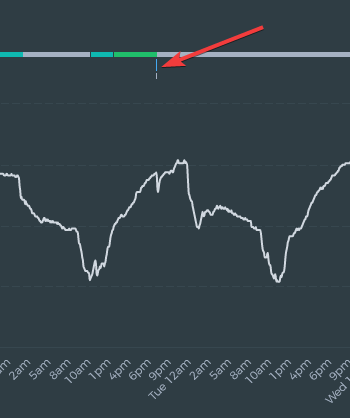
I took a broader look at the data…see the little blue blip in this screenshot? That’s when beestat sees the AC is running. But based on the indoor temperature drops it’s clear that there are other times when the AC is running that beestat doesn’t know about.
What’s happening is that beestat is calculating your resist profile based on bad data. If it doesn’t have data to tell it the AC is running, it doesn’t know how to classify the data when generating the profiles.
If you log into the ecobee web portal, does it show any AC usage?
The profiles use the past year of data, and all data is weighted the same. There are some requirements when capturing samples to ensure quality (duration, avoid transitions between comfort profiles, etc). Additionally, points that are statistical outliers are removed from the final profile.