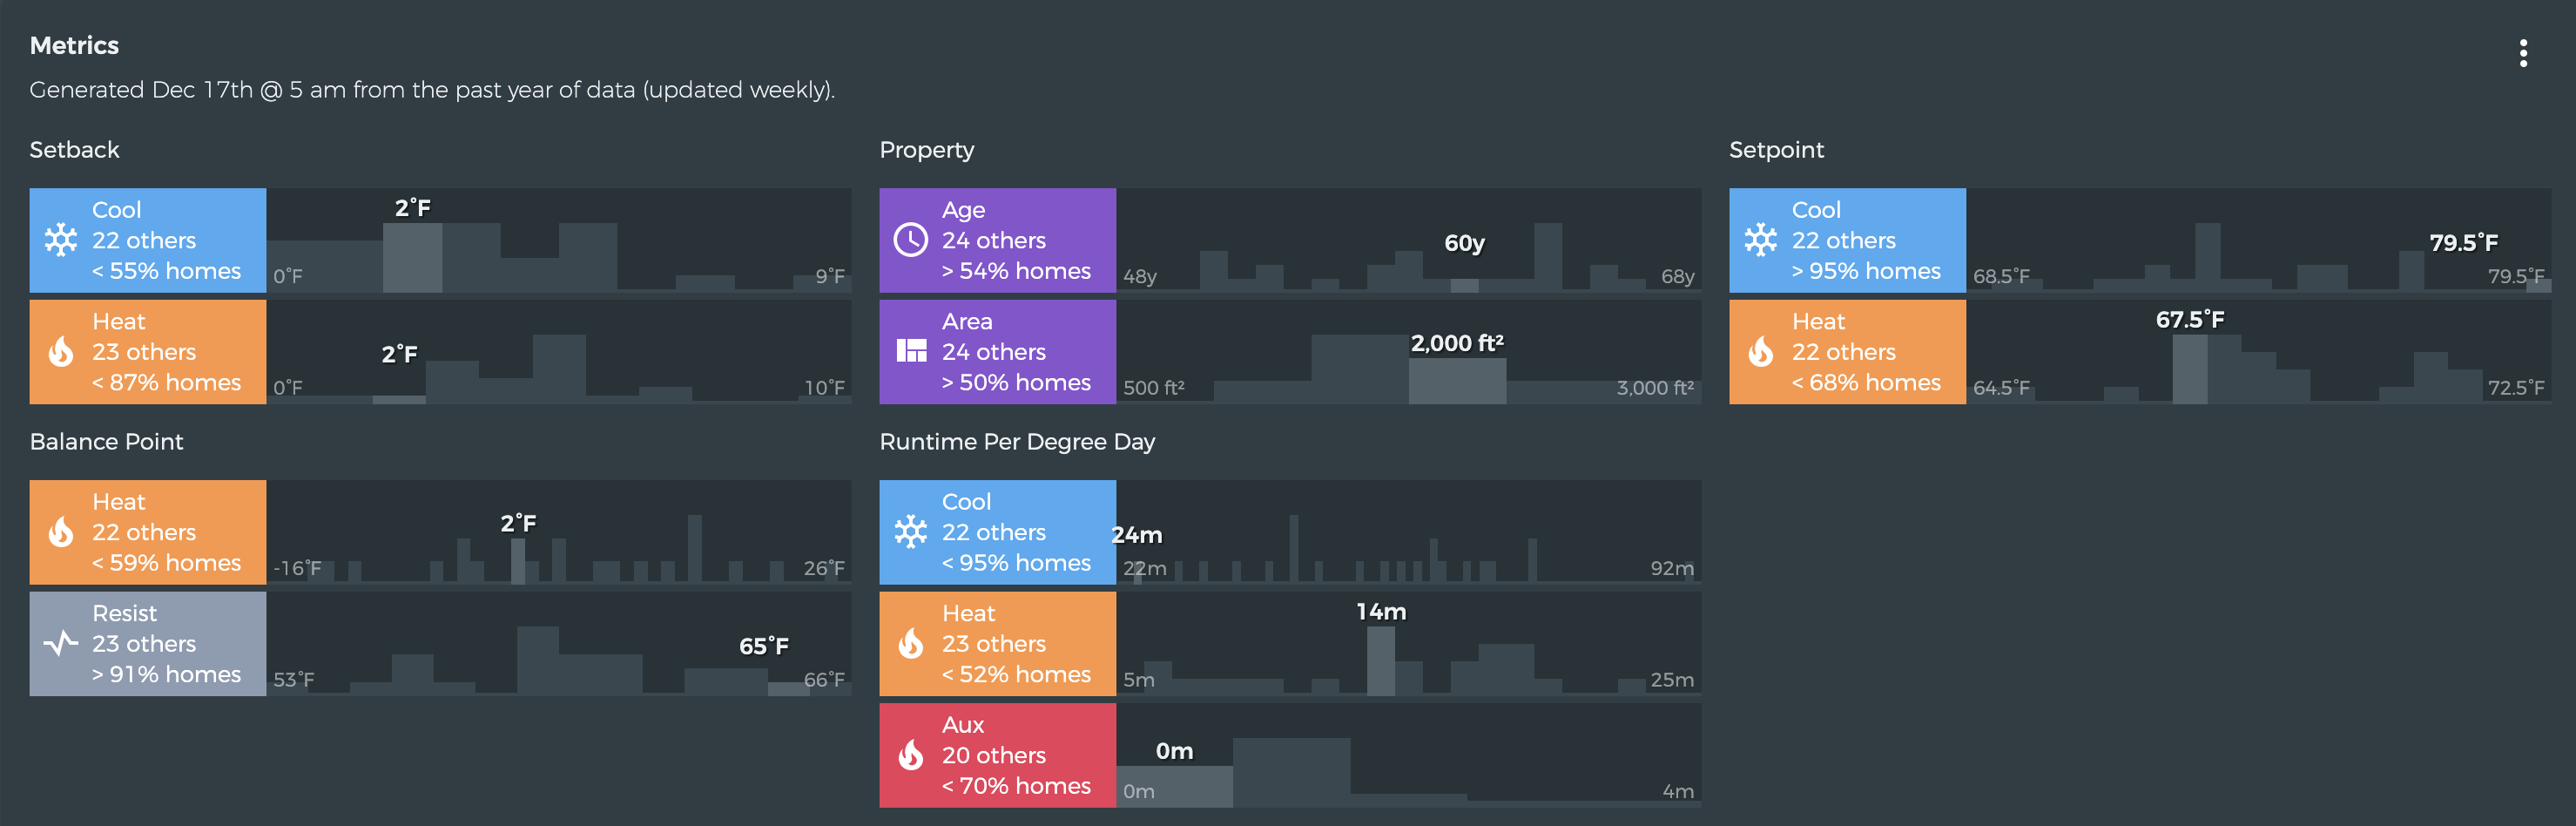
"My resistance temperature increases every year; it’s currently 65°F, whereas I believe last year it was 57°F. I’m confused because despite increasing the insulation level of my house, I expected the resistance temperature to decrease.
Even my Runtime per degree day it was 11m, now it is 14m.
Could someone please explain why it’s the opposite?
Let’s start by looking at actual historical profiles just to make sure the data is what we expect. Could you open beestat, press F12 to open the console, then run the following code?
This will download a CSV of all the historical profiles. You can share that here (might have to use pastebin if it’s too large). Just be sure to remove the address latitude/longitude portion of any profile you share.
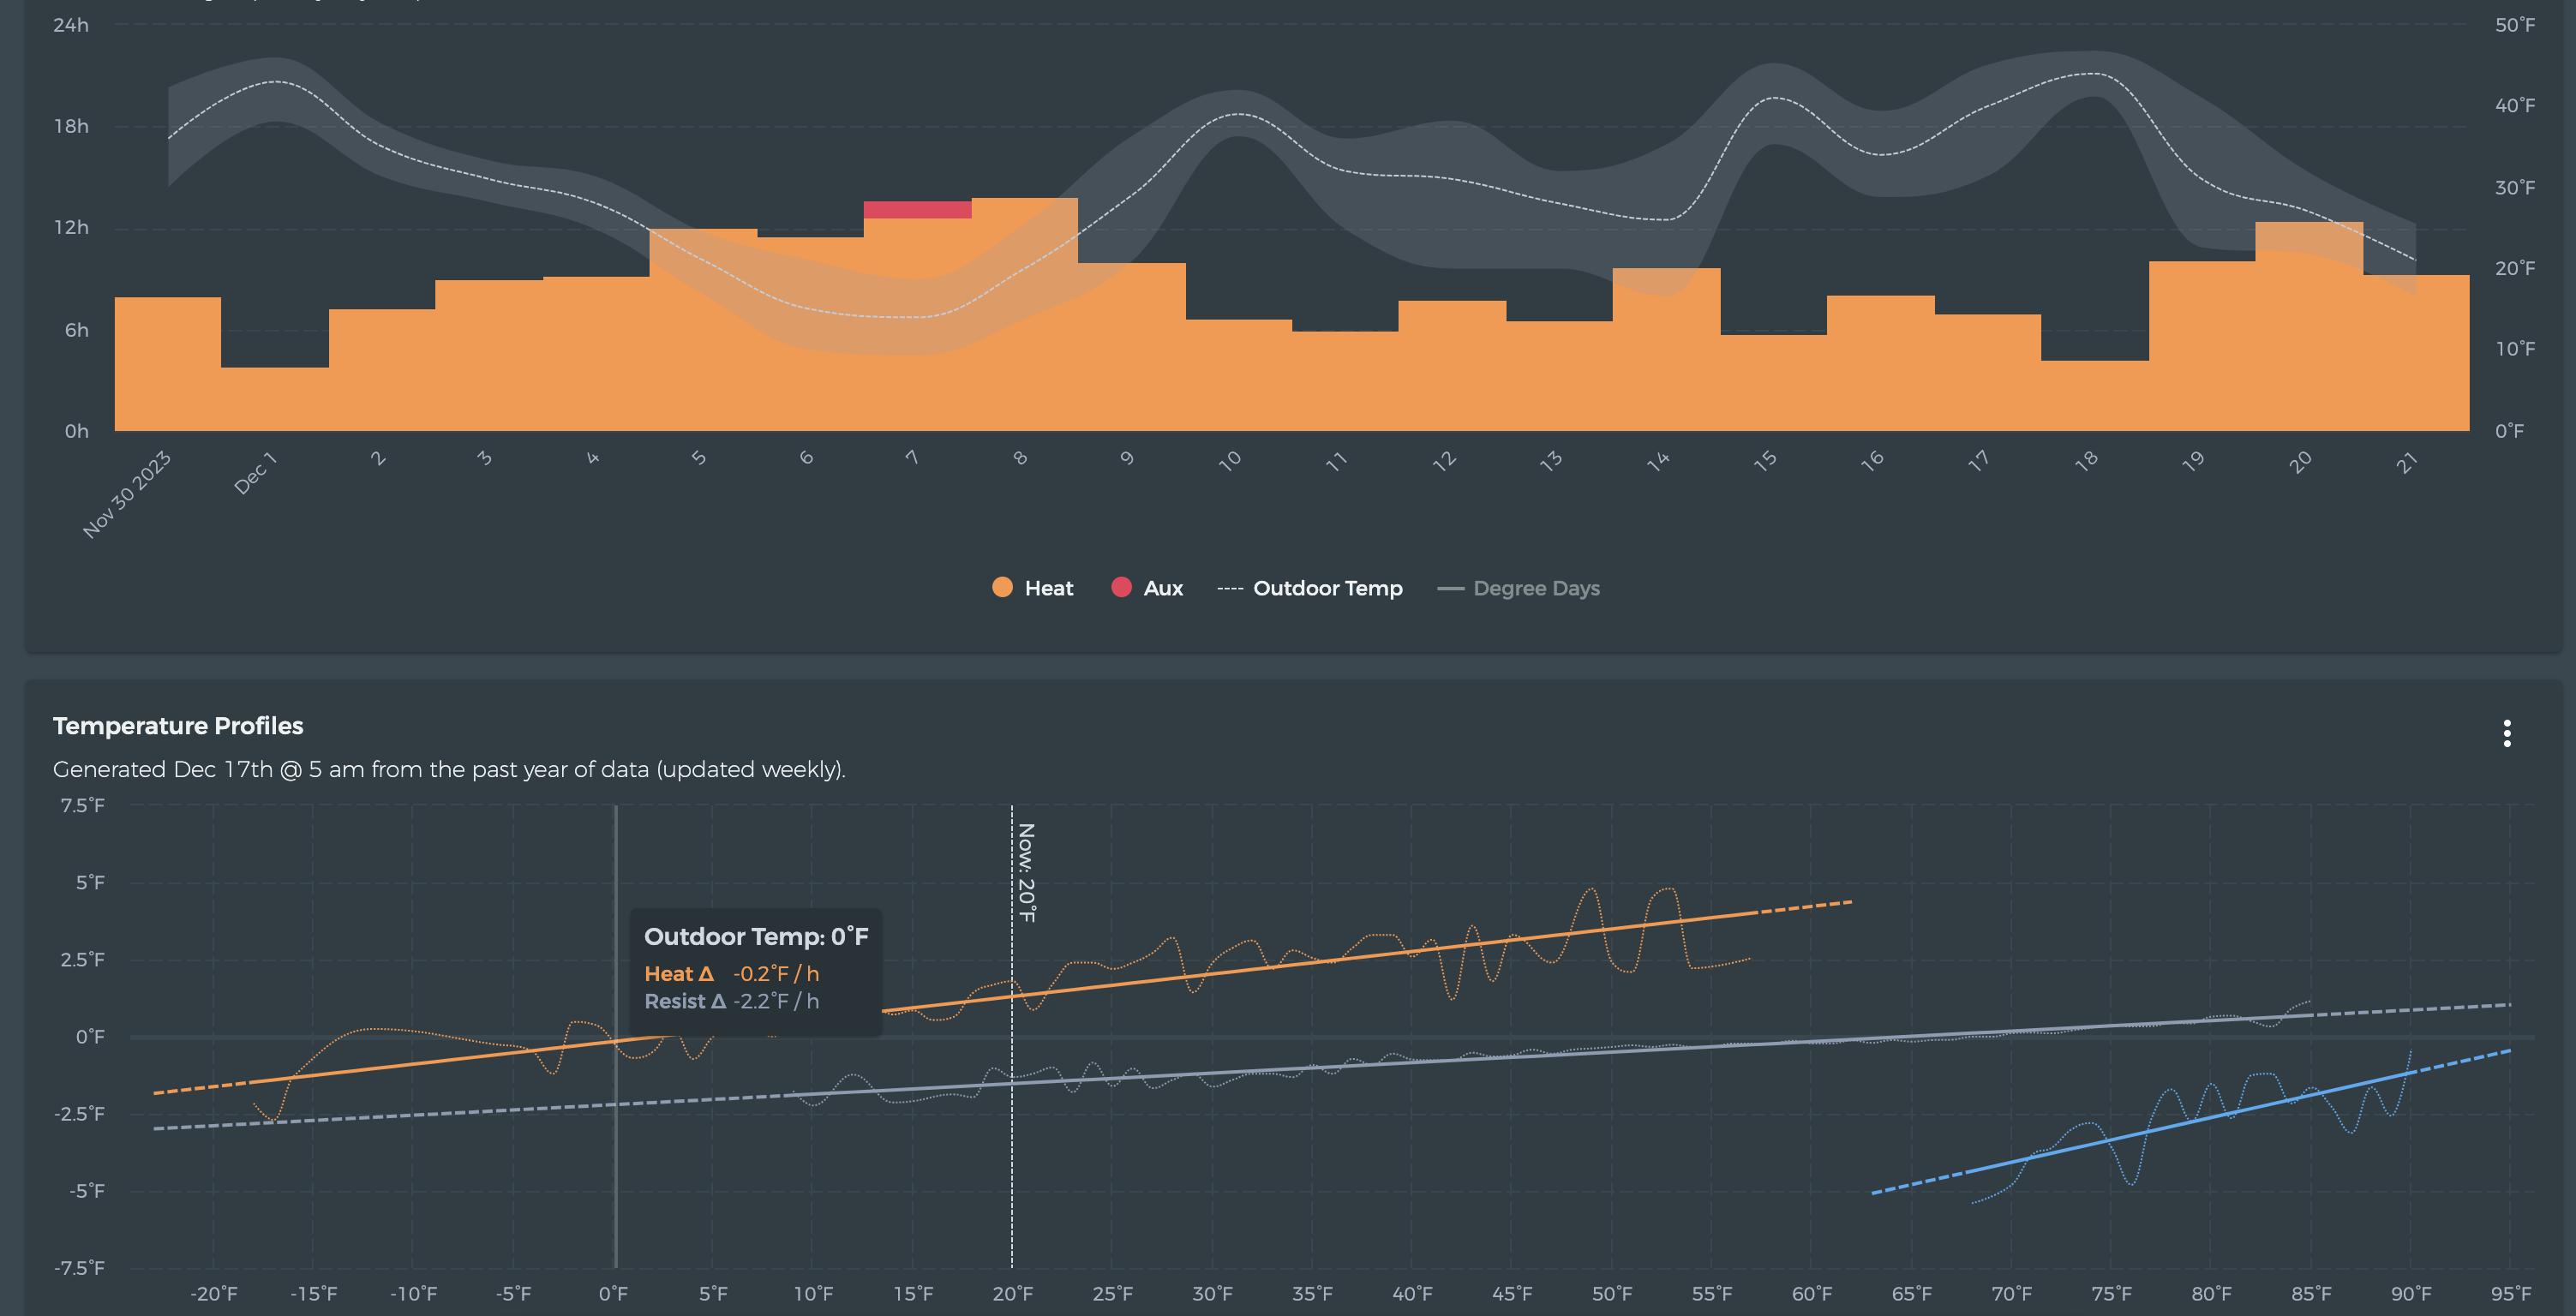
I would pay more attention to the resist slope than I would the resist balance point.
High slope = faster indoor temperature change
Low slope = slower indoor temperature change
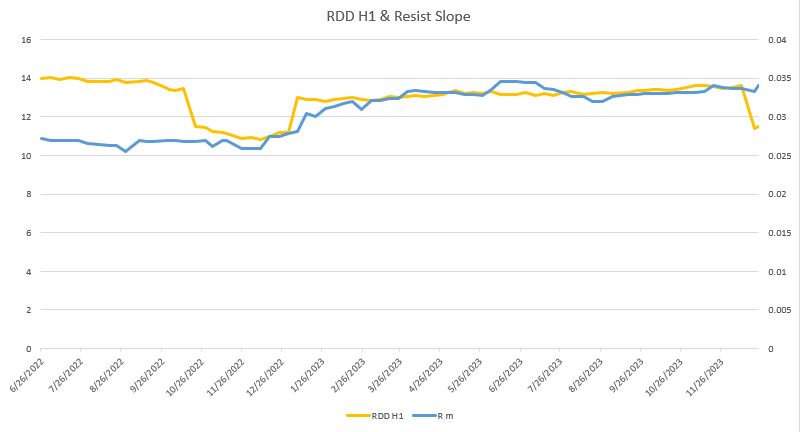
Even so, your resist slope actually increases over time, mostly starting to go up around the end of November. That would indicate to me that this heating season is worse than last year for you in terms of your home’s insulative performance.
I charted resist slope and runtime per degree day over time for you. It looks like RDD is down overall since 2022, but slowly rising throughout 2023. Note that this can be affected by other things like your system setpoint. Did anything else change about your home or your ecobee settings since the insulation change?
but since the beginning of the summer, I lost the weatherstrip of the main door, I didn’t bother to replace it maybe until mid-November.
The only other thing, that happened very recently, I changed the settings on my Ecobee to the following:
int temp = 70F (I used to set it at 68F)
diff temp - delta = 3F (I used to keep at 1.5F)
I am trying to increase the efficiency of my system, but not sure if this helps!
Added insulation to your house sometime in the last year (attic presumably?)
Saw runtime per degree day increase by 3 minutes
Saw your resist profile slope increase
The big changes in beestat happened around December/January of last year. The beestat profile generation hasn’t changed, so there must be something that went wrong. I would start laying out all of the changes that were done and when, then investigating to make sure it was all done properly as @NW64 suggested.