Really enjoying the new Degree Days view in the Thermostat Summary. Thanks for adding that!
One thing that I’d like to see is runtime per degree day over time. For example month on the X axis and runtime per degree day for that month on the Y axis. It would be great if it could be grouped up the same way as Thermostat Summary (by day/week/month/year).
I think this would be a good way to visualize how a change in settings affects runtime, normalized by degree day.
Alternately I’d take an option to export the data from Thermostat Summary, which would let me plot it myself without having to bin up the runtimes and calculate degree days.
I agree with this request. I think this is more useful than the current new “Degree days” graph in the Summary, though I wouldn’t mind having “runtime per degree day” in addition to it.
Good news is that I do have this data. Beestat generates profiles weekly, and runtime per degree day is part of that profile. All historical profiles are stored - there’s just no way to access them in the GUI today. If you’d like the info I can probably show you how to access it; it would just be up to you to parse and graph it until I make it available in beestat.
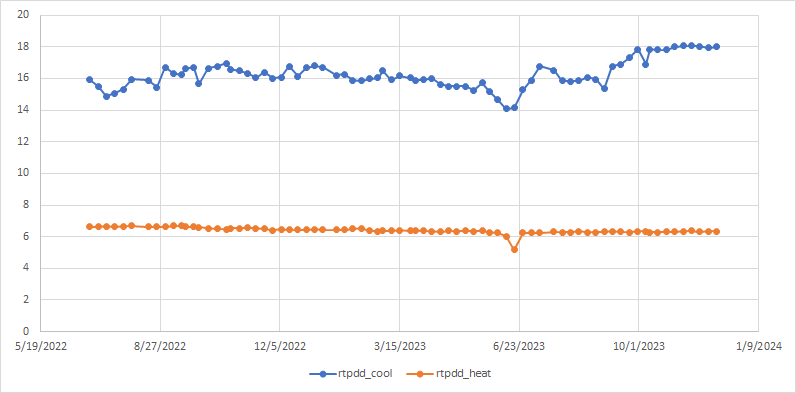
Thanks. That seems to be working. Since temperature profiles use the last year of data, is it correct to be thinking about this as a 1 year moving average? ie, The point labelled 2023-12-05 includes data from 2022-12-05 to 2023-12-05.
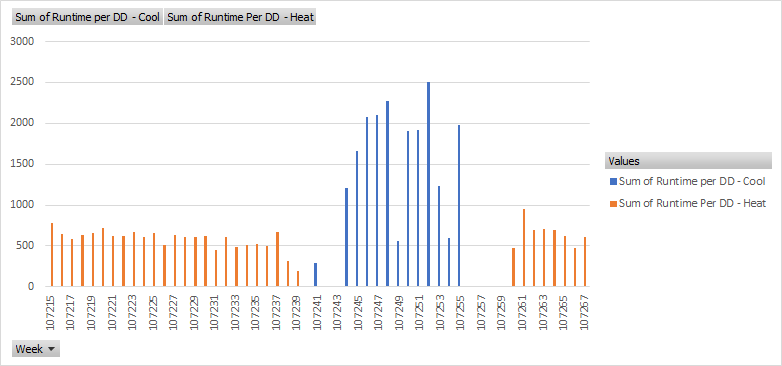
In the second: The X axis is weeks and the Y axis is runtime per degree-day for that week. So any given bar represents runtime per degree-day for a 7-day period. ex: One bar is 11/5-11/11, the next is 11/12-11/18, etc. Basically the same values in the current Thermostat Summary with some math (runtime divided by degree-days, instead of independent runtime and degree-days).