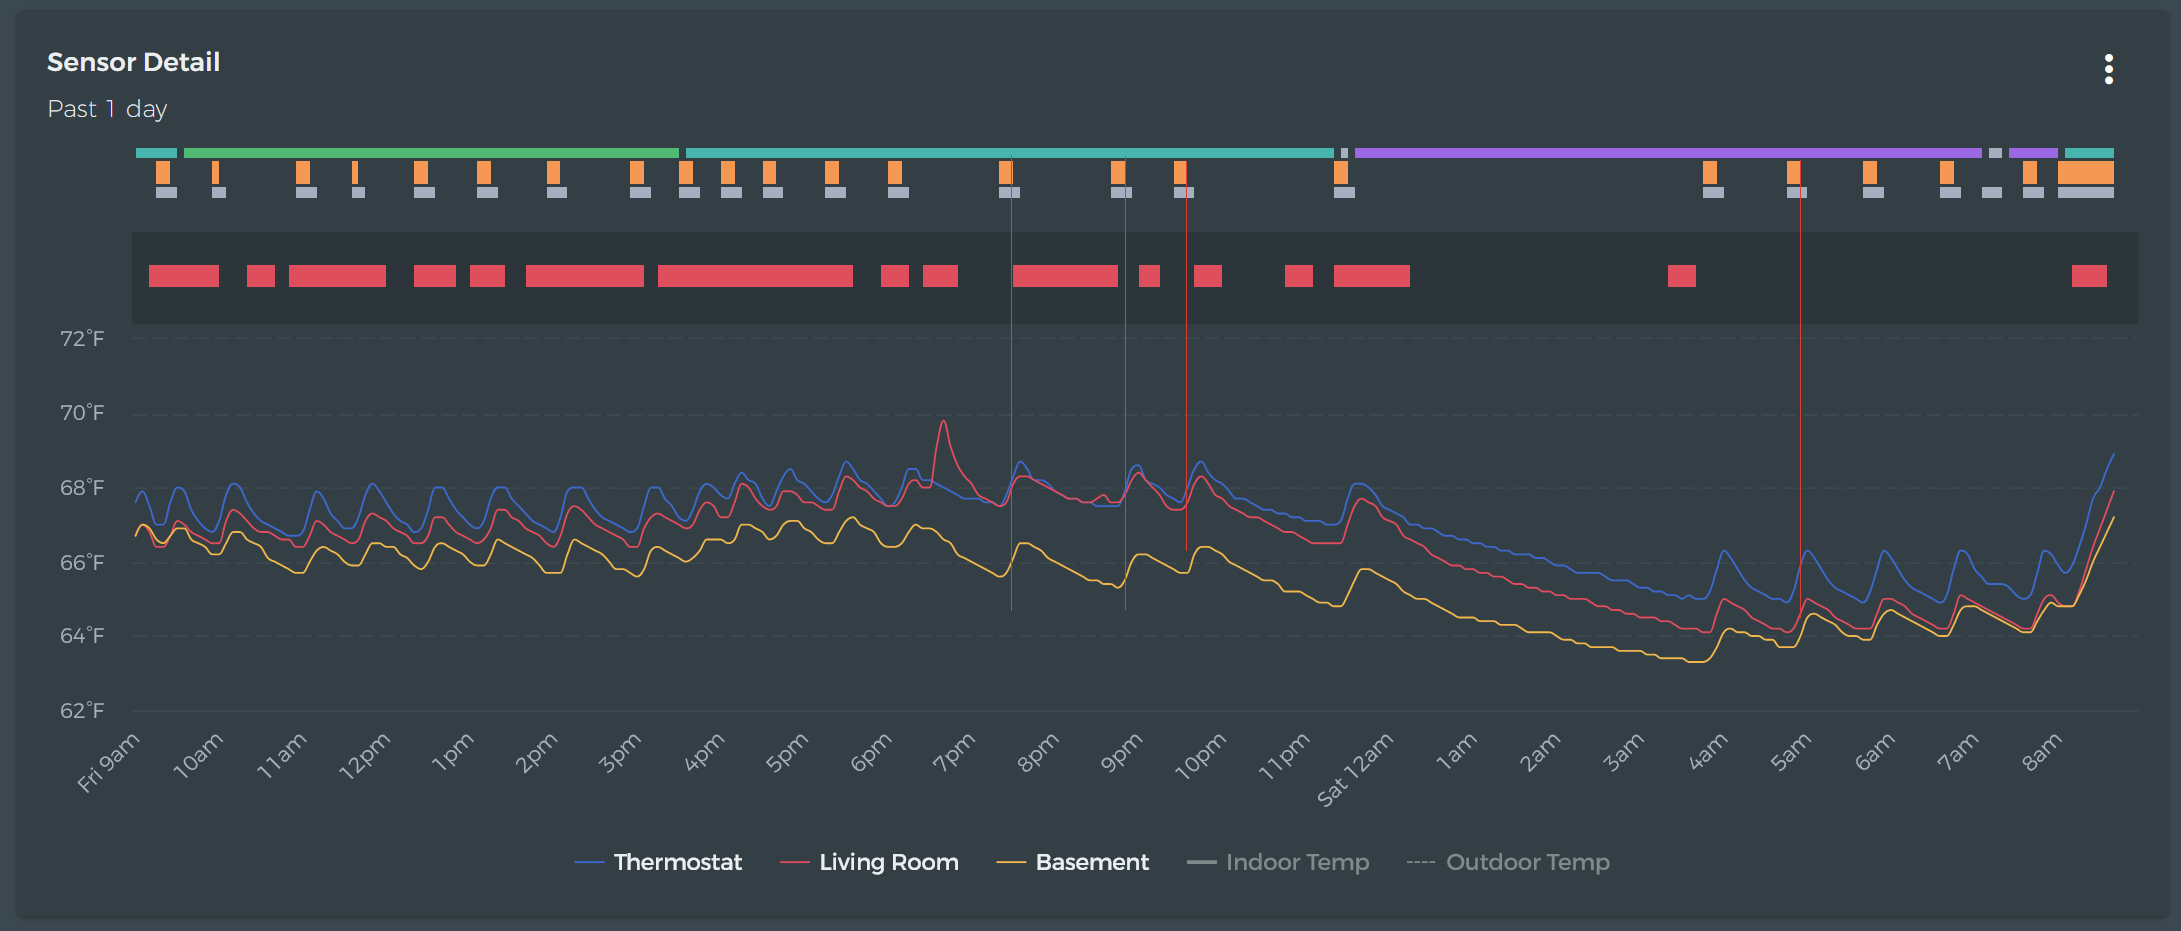
The heat is clearly turning off at what I assume to be your setpoint (68 and 66) but the temperature continues to rise shortly after. I’m not sure what (if any) algorithms ecobee has for managing that…do you have some type of radiant heating?
I do recall reading in the install guide that it’s set from mfg to keep the fan running for 2 min after. I bumped that up to 5 min in the ecobee tstat settings a week or so ago. The lagging how ever was happening before that.
I wonder if the reporting is just lagging. Have others noticed similar laggy graphs?
No - I would be surprised if this was happening. You could try to test this with a separate room thermometer…place it near a sensor and record the temps and see how they both respond. They likely won’t show the same temperature, but you should see them change at the same rate.
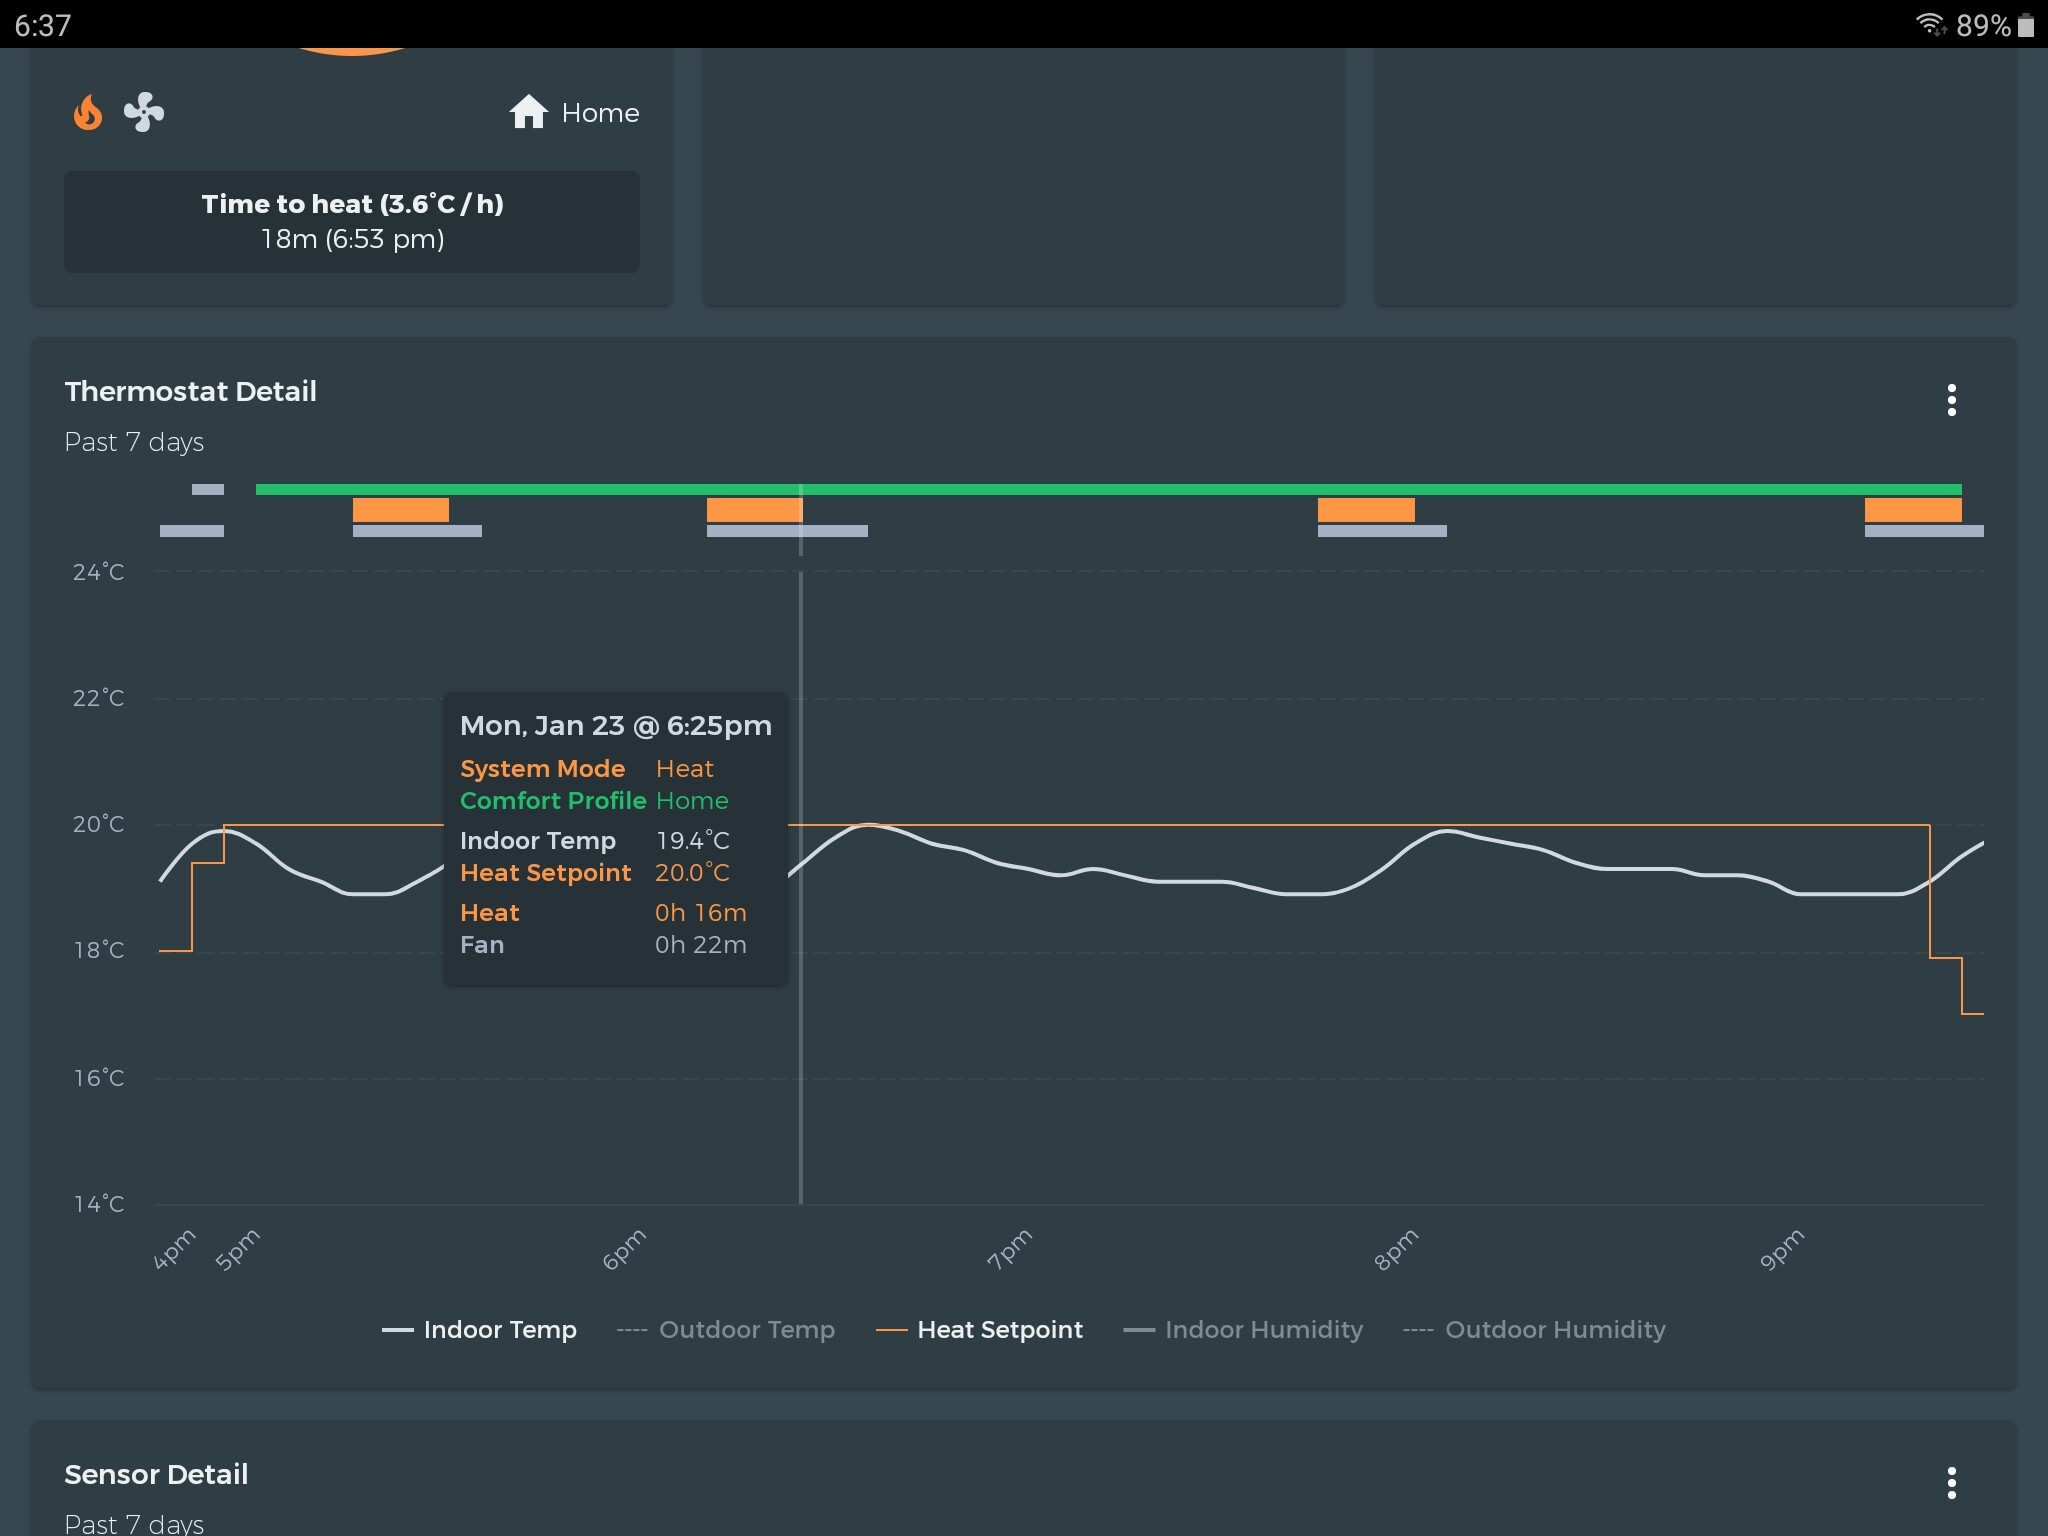
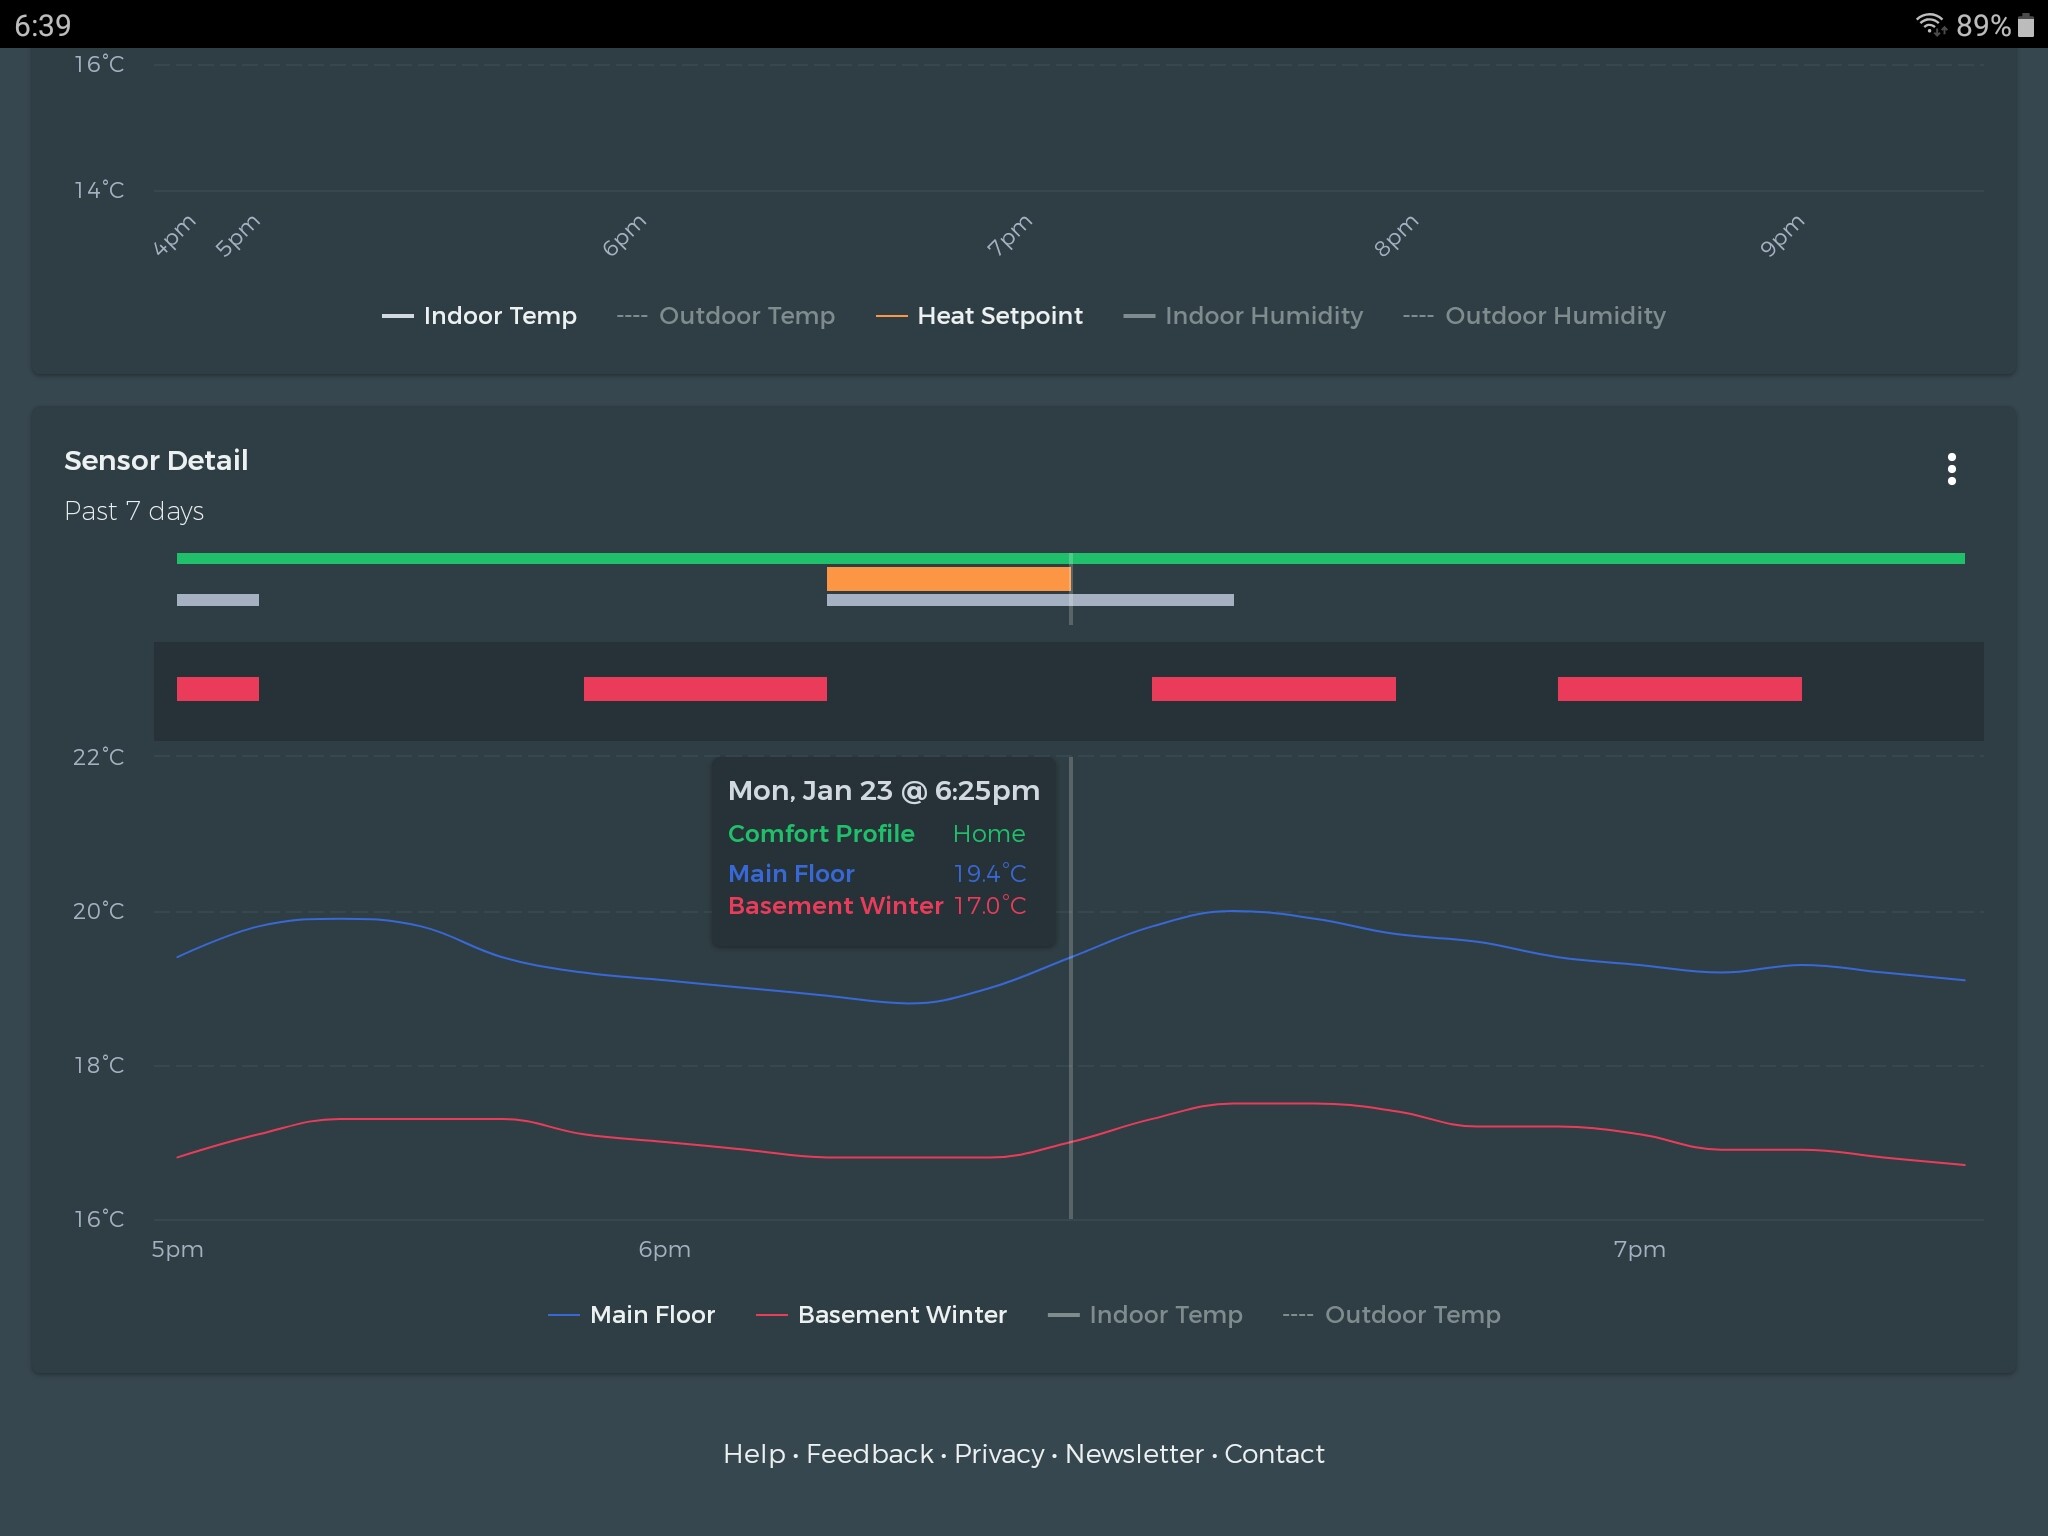
I have noticed an apparent lag between the room/sensor temp. trend data and the furnace operating times, and put it down to the 5 min resolution of the Ecobee data (i.e. a 5 min. sampling frequency is significant for tical furnace amd fan status). I have a two-stage furnace, with the fan off delay set at the furnace’s factory maximum of 3 min. Watching the thermostat and listening to the furnace cycle and fan operation I don’t think the lag real or at least that significant to explain the continued increase in room temperature that the Ecobee and BeeStat graphs suggest (i.e. I dont believe an extended fan operation is continuing to raise the room temp after the burner is off). I suspect the 5 min sampling interval is potentially showing shorter furnace run times, by up to 5 min. The other thing that support this theory is that the furnace doesn’t overshoot the setpoint, in my case. A couple trends are attached if that helps explain what I’m seeing in the data. I’ve accepted that I can’t have high resolution data, but maybe Ecobee could be smarter to use different sampling frequencies for the different variables, as is often done in process control systems and data historians. The question is does more data (resolution) help you solve the problem or understand the performance of the system. Hope this is helpful.
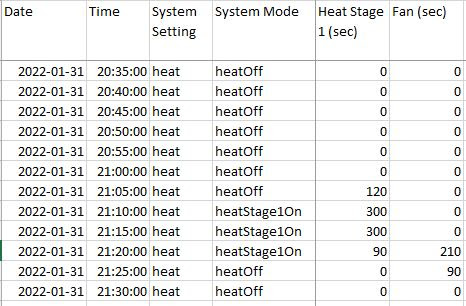
I forgot to mention that when you download the data from Ecobee you see the heat status (on/off) at the 5 min resolution, which appears to be what shows in the trending graphs, however the actual furnace heat and fan run times (delay after the heat is off) are shown as values at a 5 sec resolution, as shown in the attached screenshot of the data download. This to me confirms my suspicions. The values in seconds aren’t provided in a time series as the time data is at a 5 min interval, so of minimal value beyond totalizing of operating times.