In the Runtime Details that show how long the Heat/Cooling/Fan ran for, it shows the temperature of each Thermostat/Sensor for that specific point in time that you’re hovering over. It would be great if it also showed what the change in temperature was during that entire runtime.
e.g. AC+Fan ran for 1 hour, and the temperature on that Sensor/Thermostat changed -2.1ºF.
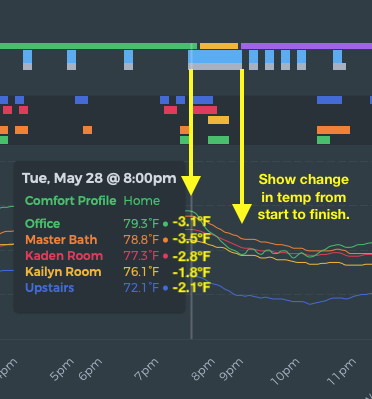
I’m doing this manually now by hovering over the start of that block on the graph, jotting down the starting temperatures at that time, then hovering over the end time on the graph, jotting down those times, then doing the math… It would be nice if this was already presented.
In my case, I’m using this information to help our HVAC company identify an imbalance in our system and how we need to address it; e.g. one room is always hotter than the others and not cooling at the same rate as the others, so we may need to increase airflow into that room. We’re also checking this over time at various points to see what the trends are, so checking each block manually is a little tedious.