Show total hvac (heat/ac/etc) runtime (in hrs) based on current view in Analyze tab

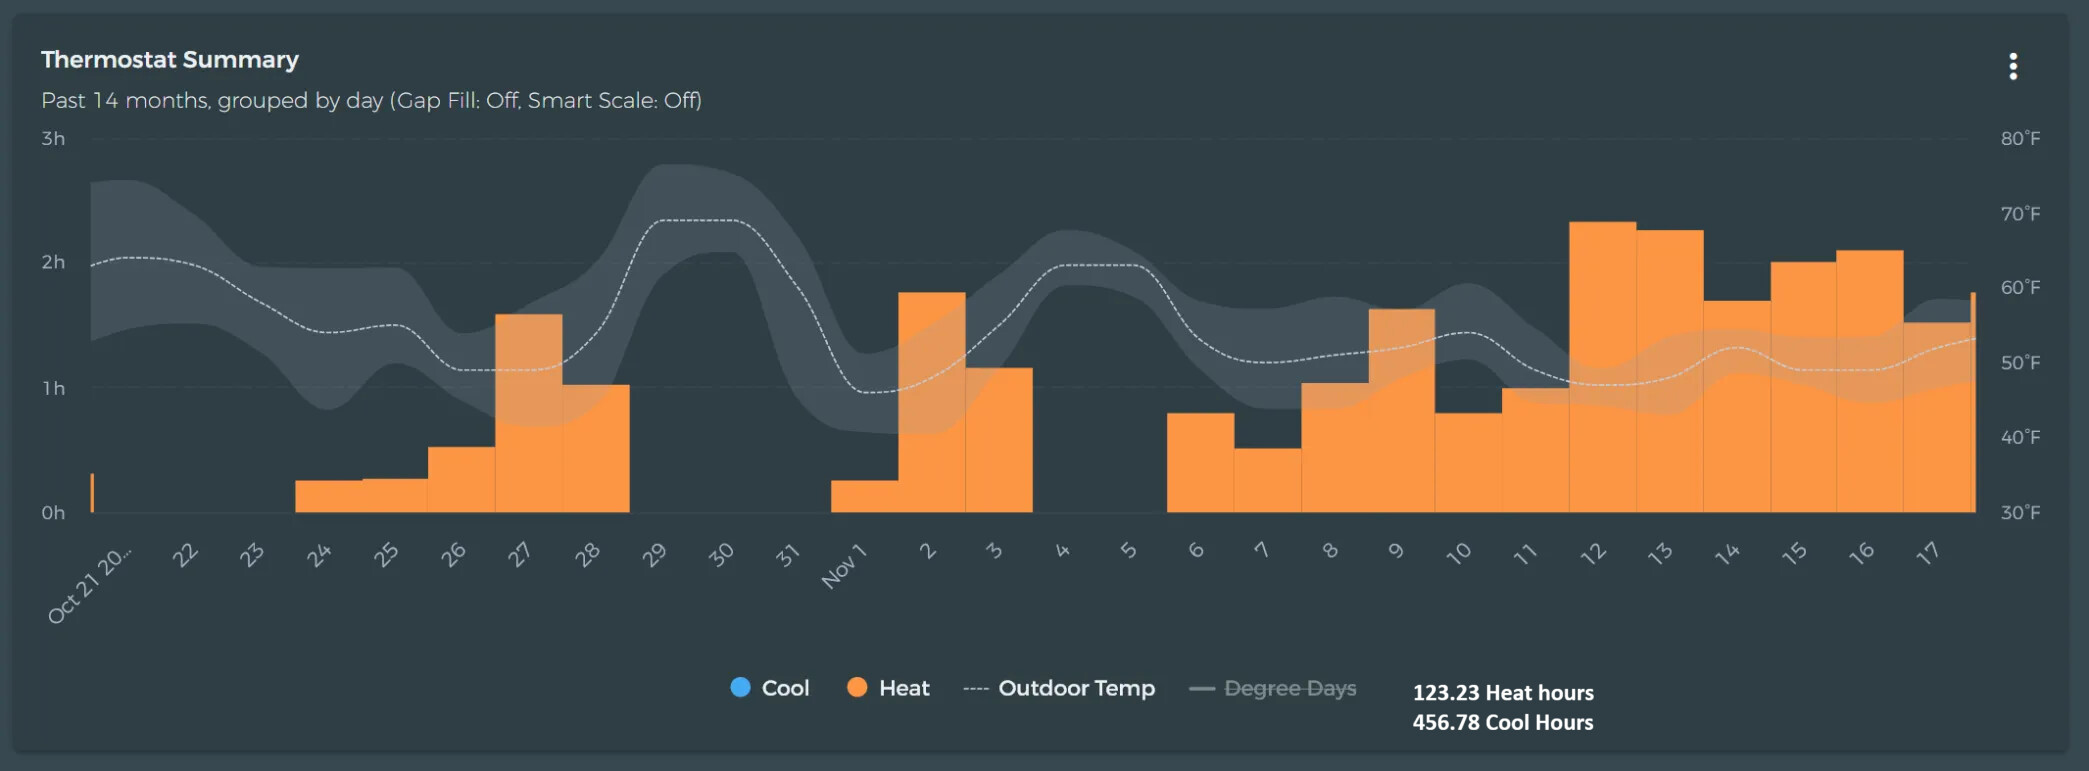
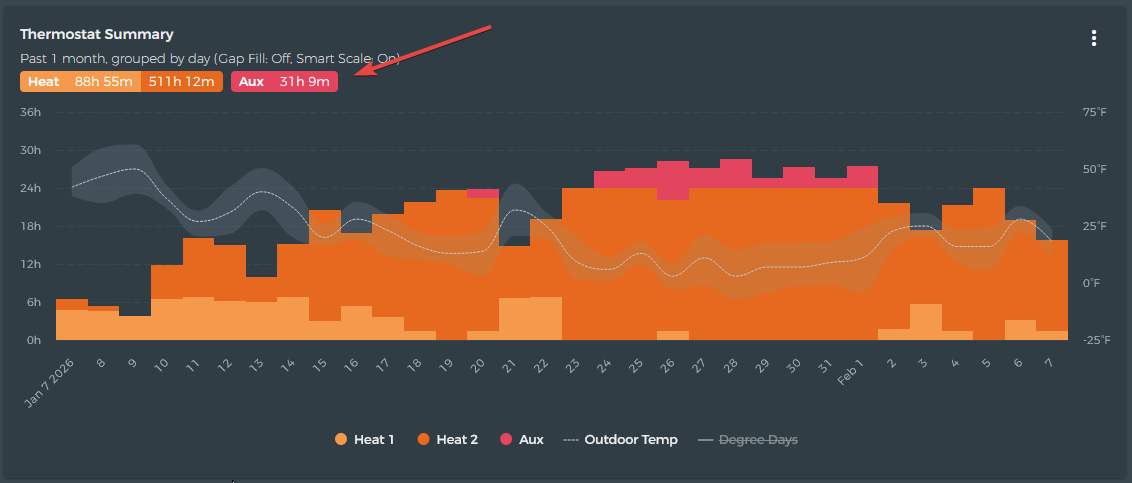
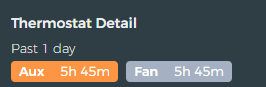
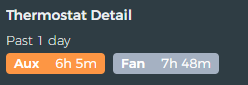
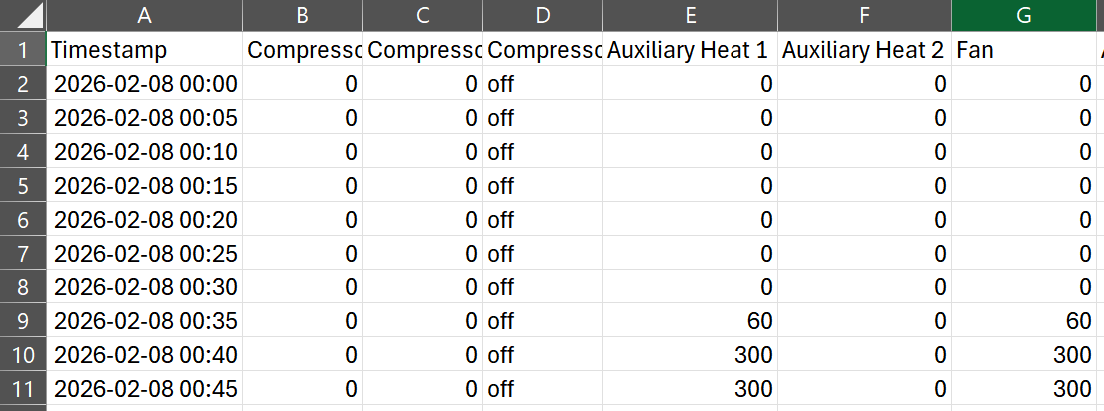
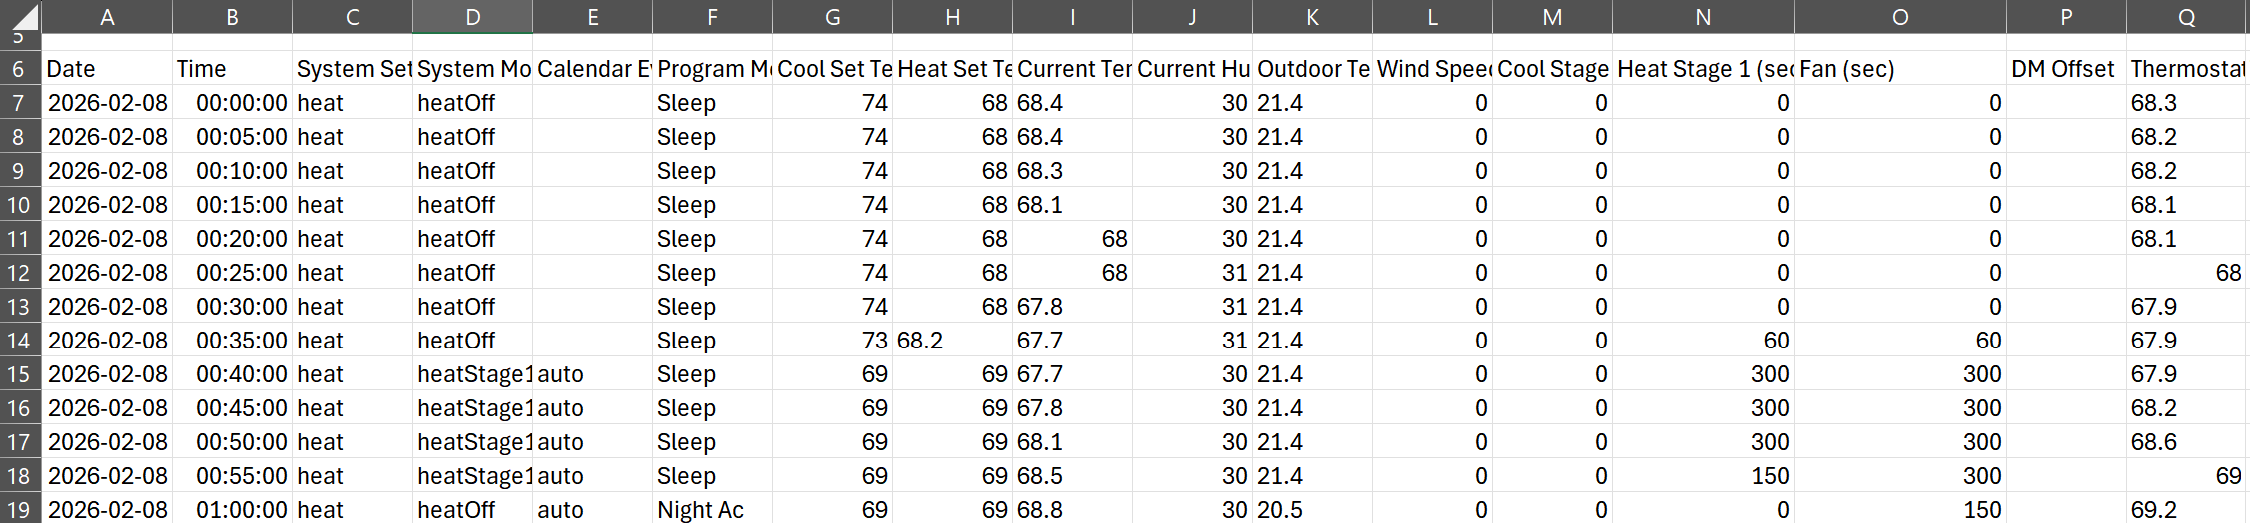
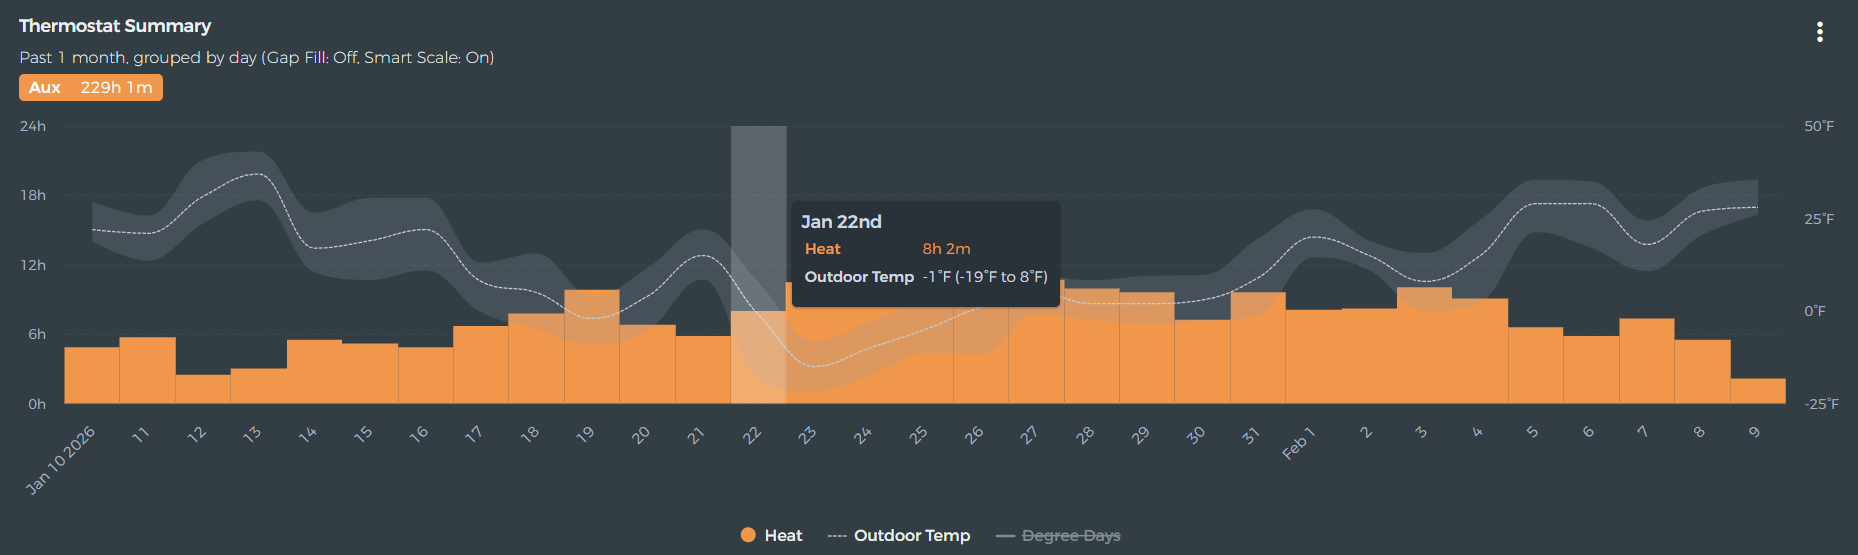
Compute total hvac activity (broken down by heat, cool, primary, secondary, etc) in hours based on data shown in current view. In other words, area (time) of the different colored bars in the graph.

This would be shown not as a tool tip, but say to the right of the legend (or where appropriate in the app).

This would be useful when viewing data from a custom range - one manually selected - ie 10/15/2025 through 11/25/2025 (or whatever range aligns with one’s bill).

4 Likes

Enjoy!

1 Like

Small bug, my both my thermostats are showing as Aux, but they’re configured as single stage furnaces.
image
image

I’ve noticed that as well. I think that’s just how it’s reported internally. Look at the raw data.

hmm.. Homeiq does call it properly.

Maybe through the api it’s called something else?

I hope to see run times based on current view/zoom in the next version of this ;). Still, a welcome improvement.

Any issues about an email to contact@beestat.io with your serial number. It might be related to configuration. The thing to check is whether or not it matches the chart legend.

Appears to not match the legend for me. Legend says Heat

Ecobee official app also shows it as Heat.

Bug…Will get it fixed soon.

1 Like

Sweet it shows up correctly now. Thanks for the quick fix!

1 Like

This topic was automatically closed 7 days after the last reply. New replies are no longer allowed.