As a Patron, I have access to the Experimental Temperature Profile.
My understanding is that the Experimental version removes the influence of passive solar warming of the house during equipment runtimes. I don’t fully understand how this works, especially as I have a heat pump which becomes significantly less-quick to warm my house up when it’s 0°C outside, and would love a detailed explanation of what it’s doing…
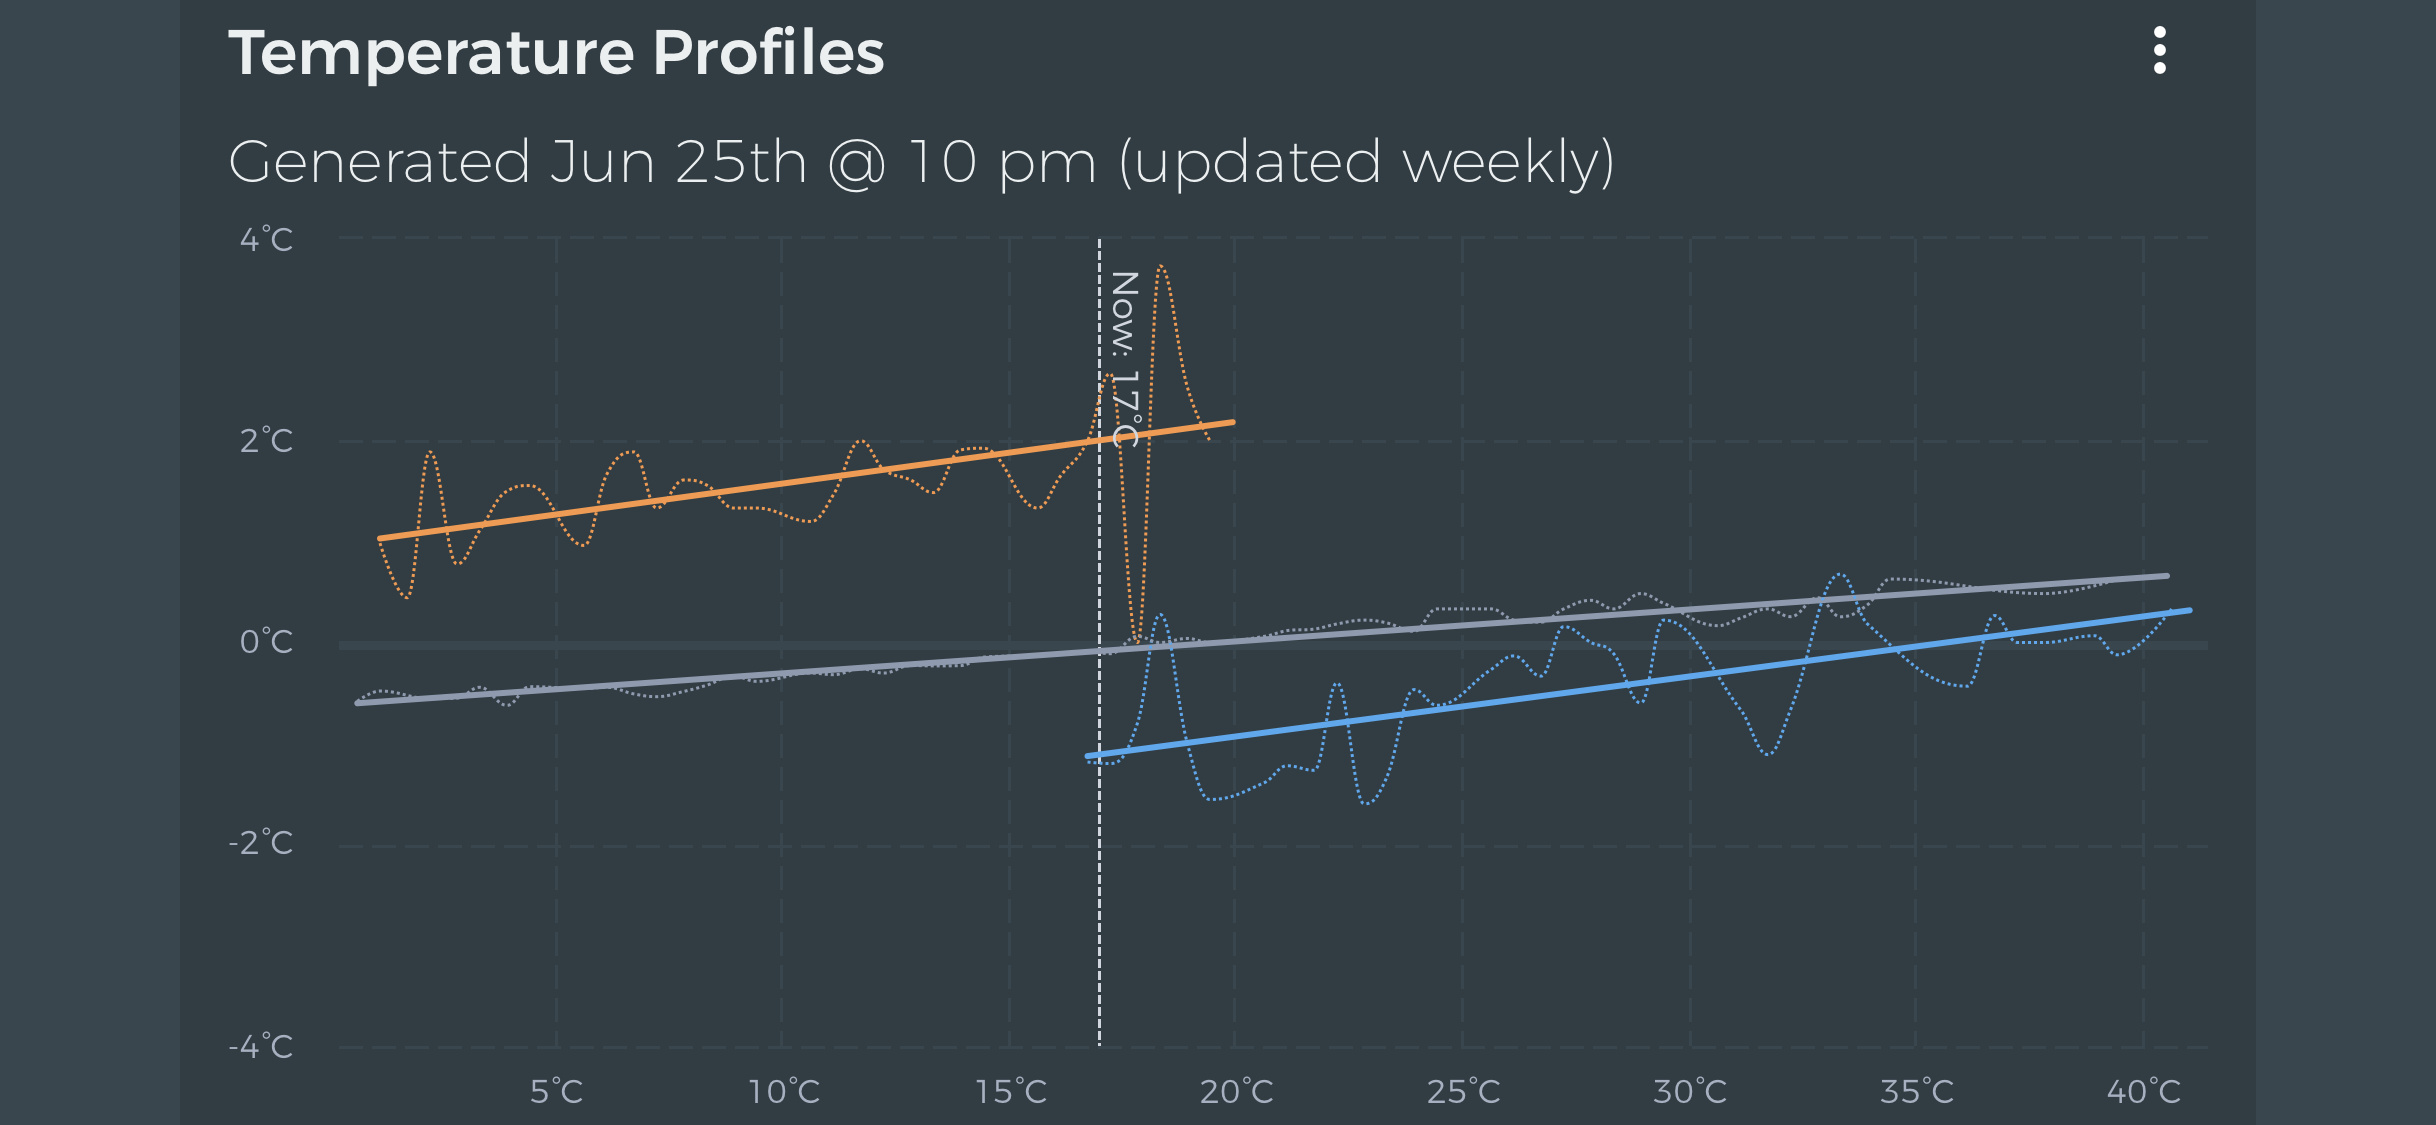
Anyway! The experimental graph has a very odd Indoor Temperature Delta, with the slope actually negative ie it gets cooler inside as it gets hotter outside. This… doesn’t seem to make sense?
Further, regarding the old style Temperature Profile graph, I’m curious if there’s any way of analysing the data that makes up the plot. For some reason, when it was 18°C outside, the heat pump added +0.0°C/hour to the indoor temperature. But, the data points surrounding it show +2.0°C/hour to the indoor temperature. Where is this outlier? It would be great to be able to find it so I could work out if there was a fault with my system at that time.
It works by simply ignoring data when the sun is out.
I would say this is definitely wrong. It looks like in your case there’s a spike from 6-9°C that is causing the trendline to shift in the wrong direction. Were you maybe running a space heater or fireplace?
The timestamped data is not currently stored anywhere. Basically, for the outdoor temperature of 18°C, there were one or more data points that averaged out to an indoor change of 0°C. If I get some time this afternoon I can run your profile and dump the raw data so you can take a look. I’ll have to think about a good way to expose that data in the GUI.
I was thinking, I have a rambler/ranch 1 story home, with finished walk out basement, my home is seen as a 2 story.
Between 2000 and 4000 sqft
At least 2 stories
I am not sure if that is the correct setting. it has been set to that for 3 years.
thoughts ?? (I think it still would be a great project for insulation/foam spray)
As a follow-up, beestat is no longer ignoring solar heating. I had many users who stopped getting heat profiles due to lack of data. Additionally, solar heating is part of your home’s profile. Ignoring it makes your nighttime profile really accurate, but your daytime profile less accurate. Allowing daytime samples puts the trendline more “in the middle”.
Additionally, some other updates to profiles went out recently to throw out obviously-bad data points which should improve accuracy.