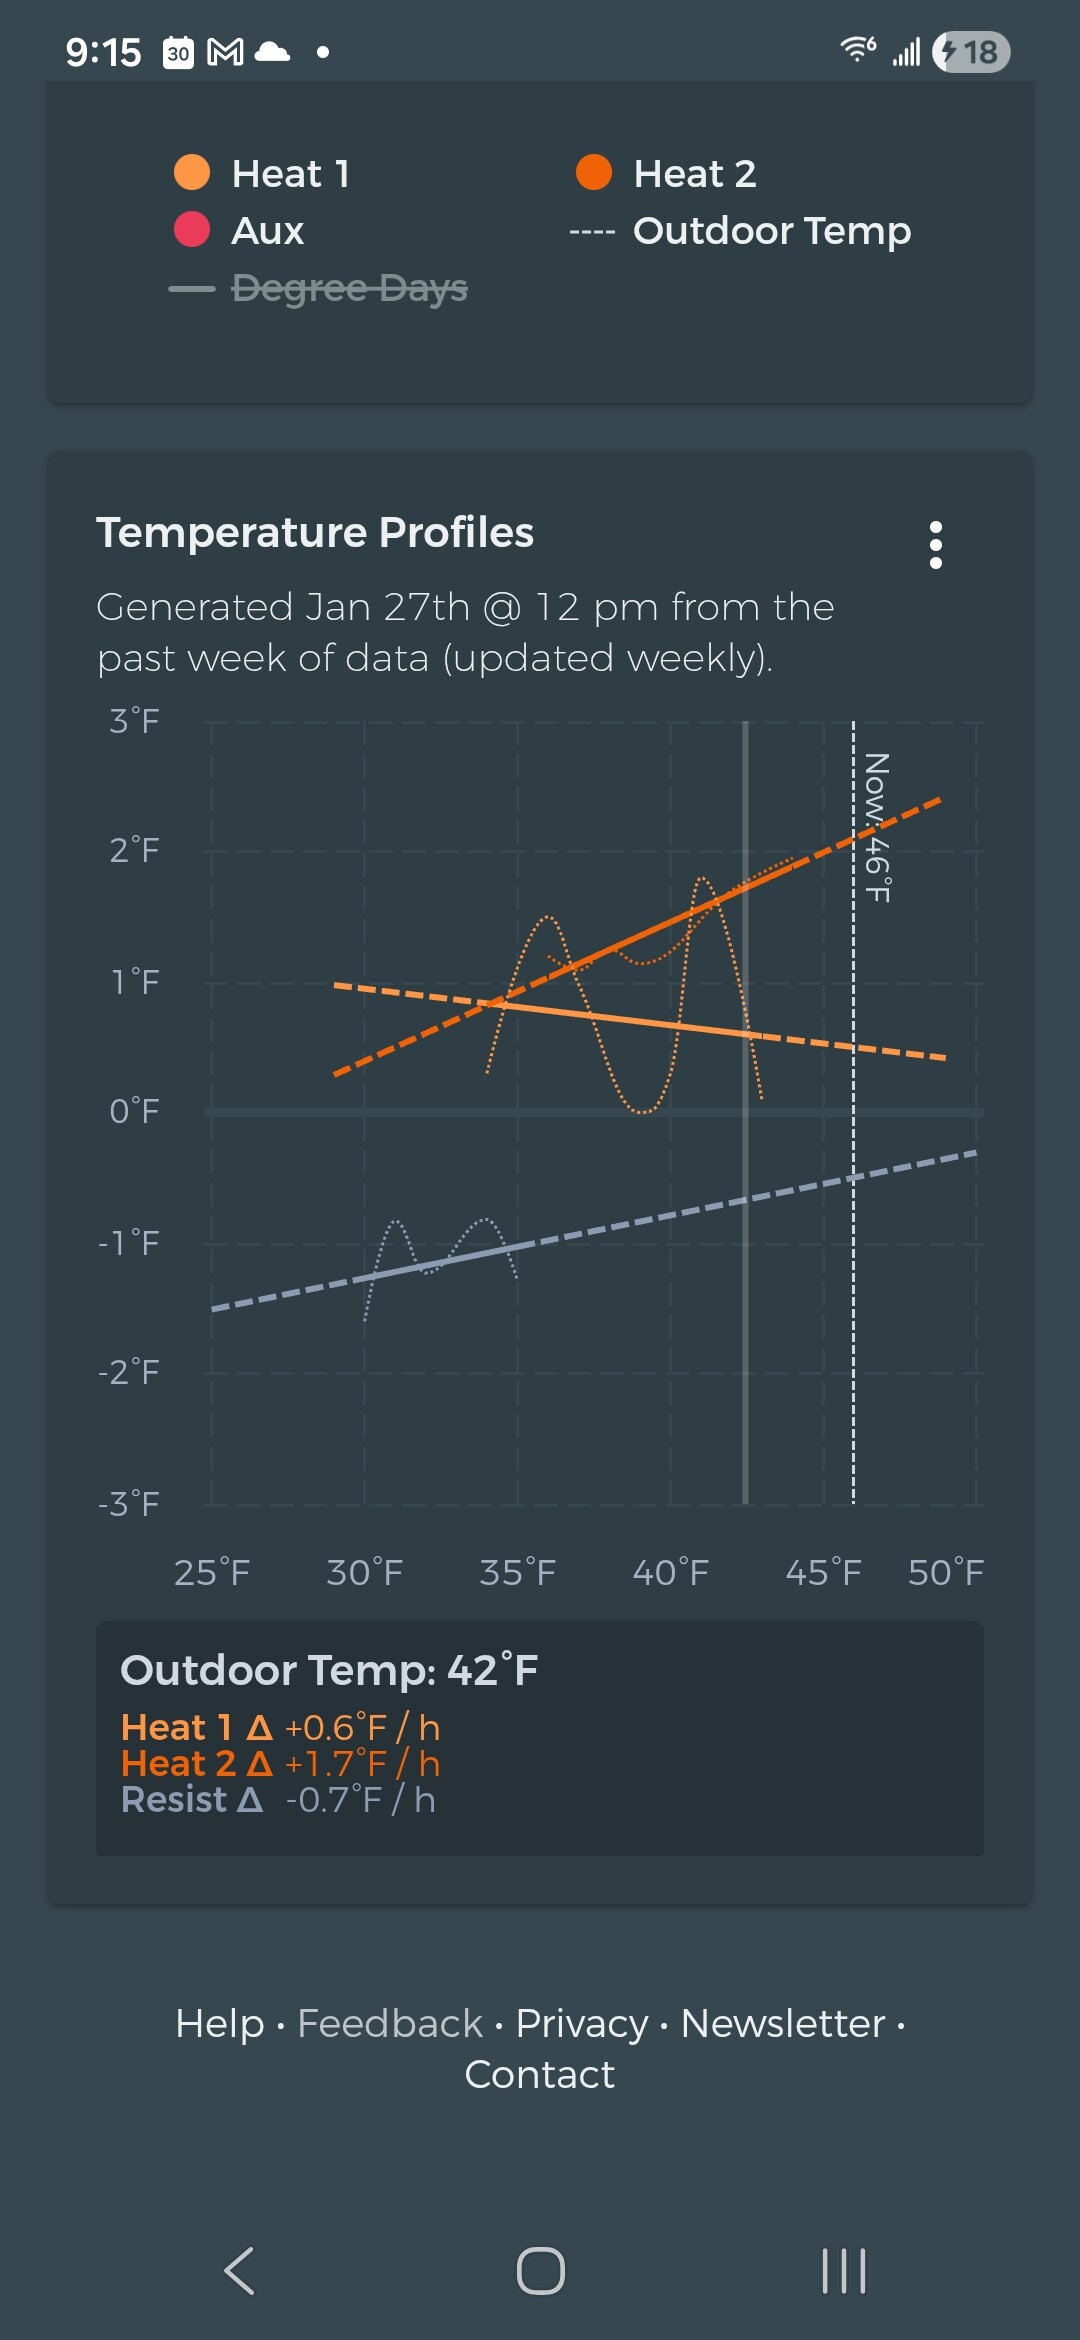
New to.this but when i look at this chart i think the signa of heat 1 and resistance are reversed.
Hi Dave!
Not 100% sure what you mean, but I will say that you’re seeing a chart generated from only a week of data. Beestat technically has enough data points to draw a nice line, but it needs a bit longer to collect data to smooth those lines out. Right now I can see that your stage 1 heat is definitely off, but that’s due to some noisy raw data.
Here’s some good reading to get you started on what you can expect from this chart: Notion
Let me know if you have any questions!
7 days of data isn’t enough for temperature profiles to look clean. the chart will look “reversed” when there’s noisy runtime or brief resistance heat calls mixed in.
if your thermostat is occasionally kicking on aux during recovery, it’ll skew the slope early on. give it 2–3 weeks of steady data before assuming heat 1 and resistance are flipped.
if resistance is actually running a lot during normal cycles though… that’s a config issue, not a chart issue.