If you’re reading this you may have some interest in the recent change to beestat that replaces scores with metrics. This is a big change and I hope you’ll take a few minutes to learn about the feature and share any feedback you have.
Important: This feature might be buggy! I prefer to vet releases more carefully to reduce impact on beestat users. In this case, I’ve been away from beestat for six months and aiming for perfection is blocking many other things from getting done. Please be patient over the next few weeks while improvements are made.
When scores were originally developed, I came up with a few metrics that I thought were important and plugged them into a home-grown formula that would spit out a number from 0-100. It performs reasonably well, but leaves a lot to be desired. There’s no explanation of how your score is calculated, and you can be penalized simply for wanting to be comfortable or having a home of a certain size.
Why are metrics better?
Metrics are everything scores should have been. They take all the things that were part of your score calculation (and more) and expose them directly to you. It’s all facts and they allow you to see exactly where you stand against other ecobee owners.
What do the metrics mean?
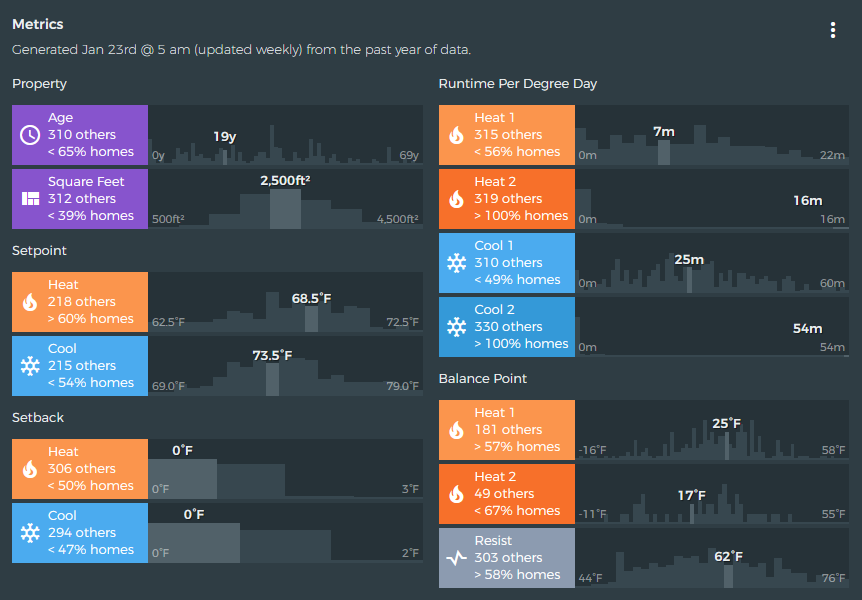
Property
This simply shows how your home’s age and size compares to other ecobee owners in your comparison group.
Runtime Per Degree Day
This metric normalizes runtime against the outdoor temperature (degree days) so you can directly compare across climates. If it’s confusing, just know that lower is better.
Setback
The difference in your home vs away setpoints. Determined just by your current schedule.
Setpoint
Shows the average heat and cool setpoints over time.
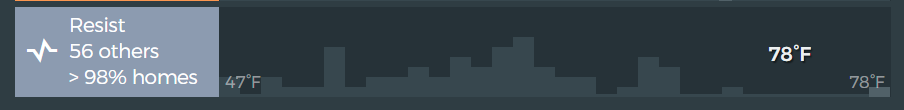
Balance Point
The outdoor temperature at which your indoor temperature does not change. Heat pump users will enjoy this for their heating, but all users can still see the resist value.
Will there be more metrics in the future?
Probably! I’m not sure when or what, but I would love to expand this to give you tons of relevant information.
Why does it seem like there are fewer other thermostats to compare to?
The new metrics are more aggressive about what a valid comparison is. This update requires that the system type and stages for both heat and cool match. Previously, two stage systems would actually get compared to single-stage systems which was incorrect.
Can you explain the run time per degree day a little more? For instance, in your example above, what does the 7m in heat 1 represent? Same for the cool, what does the 25m represent?
If you have a minute, here’s a great place to learn what heating and cooling degree days are: Degree Days – An Introduction
From the website:
Heating degree days are a measure of how much (in degrees), and for how long (in days), the outside air temperature was below a certain level. They are commonly used in calculations relating to the energy consumption required to heat buildings.
It’s basically a way to quantify how hot or cold a place is by looking at discrete points in time instead of using an average. As a simple example, let’s say it’s 80°F (daytime) for half the day, and 50°F for half the day (nighttime). The average temperature for this day is 65°F which might imply that you don’t need to turn the air on.
Realistically, though, you had to turn the air on during the day when it was 80 out. What HDD and CDD do is break down the day into smaller chunks and provide you a number that you can use to determine how much you might have needed to run the heating or air conditioning that day.
As a practical example, you can actually look up average HDD and CDD per year for your region. I run my stage 1 heat pump for 7 minutes per degree day. My region of Indiana has 5699 HDD, which means my stage 1 heat pump will run for 664 hours in an average year. You can also do the same math by day or whatever other time period.
Finally, it makes little sense to have a metric for “runtime”. A house in Indiana and a house in Texas have drastically different summer temperatures. A metric of “runtime per degree days” normalizes both homes so the effect of the outdoor temperature (mostly) goes away.
Make sense? I probably need to write a guide on this. It’s really powerful data but it took me a while to understand.
This is pretty confusing. The old number suggested my house was very inefficient for heating and a little more efficient for cooling - and pretty inefficient generally. These new metrics appear to flip everything around.
I would suggest that the old data was simply wrong, but I can take a look and try to give you a reason. The new metrics and profiles fix some issues and should be more accurate. Can you PM me your thermostat serial?
Thanks for the quick response. The article was very helpful. What base temperature do you use? Is it my resist, or balance point, or do you have different numbers for heat and cool? Is it unique for each house, or do you use each house’s balance point?
If you want to get technical, every building can have their own base temperature and should probably be the resist balance point. However, there are some standards that are useful and if you want to compare across regions you need to use the same value everywhere. Beestat uses an outdoor base temp of 65°F.
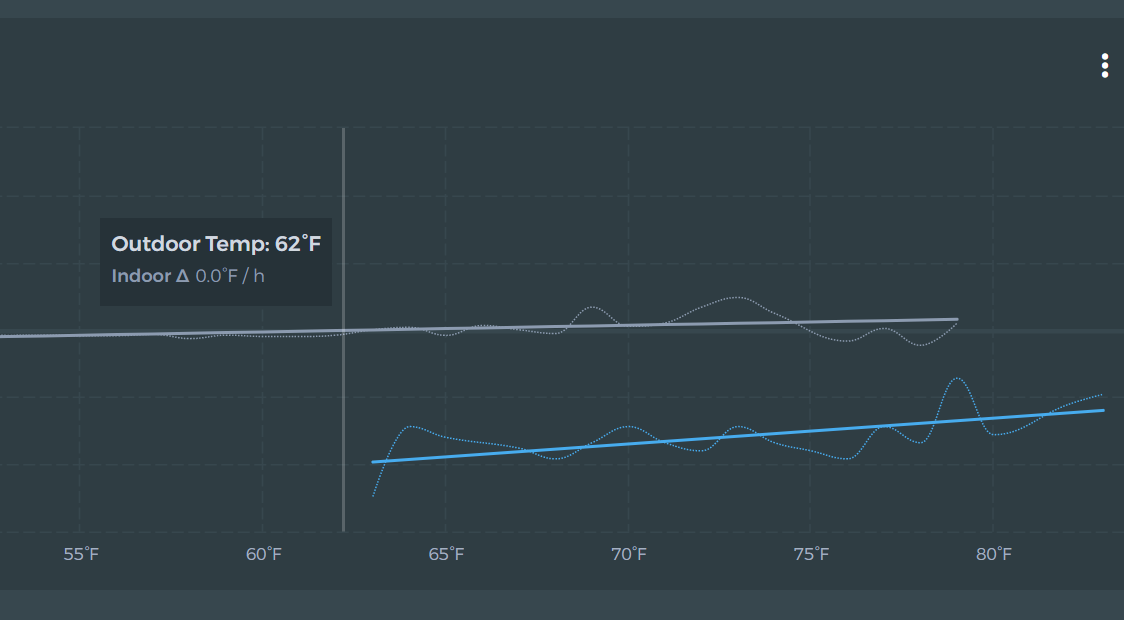
My resist temp is 49 degrees which still shows a -.01 delta. On my graph, it starts at 52 and goes up to 62 degrees where the temp diff starts to rise. The temp delta is at 0 in my 10 degree zone above. Thought you might want to know if this is a bug. I’ll dm my stat I’d to you. PS: I replaced 32 windows in late November.
It’s showing a resist balance point for my house of 78 F, which is not accurate based on my experience. The Analyze Tab shows a resist temperature delta of 0.0 at 62 F, which is in line with my experience.
Those values sync from your ecobee so you need to set them there. I don’t believe it’s in the app so you need to do it on either the thermostat or the ecobee web interface.
When I first looked at the new Metrics it was a bit confusing as I was set to “nearby” and “very similar” which only generated results for 2 homes. Once I adjusted to “Global” and “All” I was able to see some comparisons that made what I was seeing with “nearby” and “very similar” a bit clearer. The only issue with that , and it’s minor, is that Runtime Per Degree Day is shown but not where that degree day data is drawn from.
Overall though this gives me a better and more accurate idea of how my system compares to others than the original comparison chart